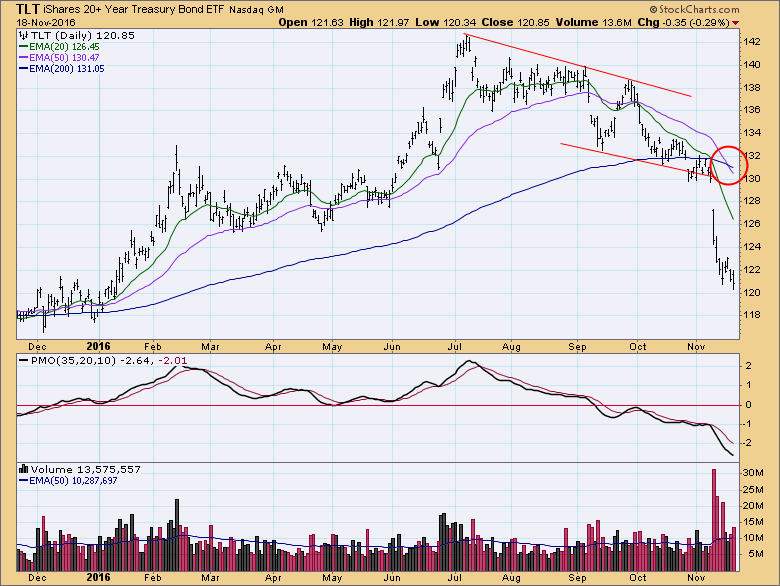
When we discuss bear markets, we usually think of the major market indexes, the S&P 500 Index in particular; however, any price index -- market sector or even an individual stock -- can be experiencing a bear market, even in the midst of a broad-based bull market like we are experiencing now. In my opinion, an objective definition of a bear market is when the 50EMA of price is below the 200EMA (commonly known as the "Death Cross"). This week long bonds had a 50/200 downside crossover, which confirms that, yes, the price drop we see is indeed as bad as it looks. Long bonds are in a bear market.
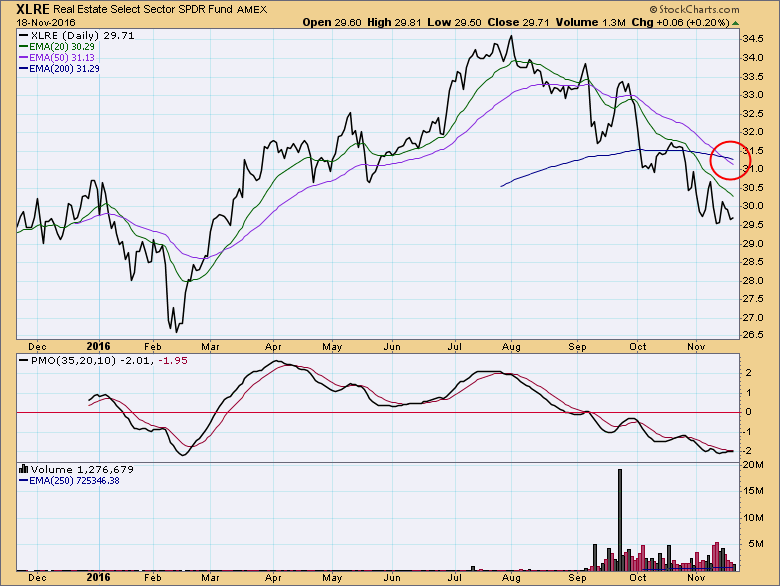
The new Real Estate SPDR (XLRE) that was spun off from the Financial SPDR (XLF) recently had a 50/200 downside cross. I found this one particularly interesting because the spinoff seemed to me to have been done in anticipation of the deflating of our latest real estate bubble.
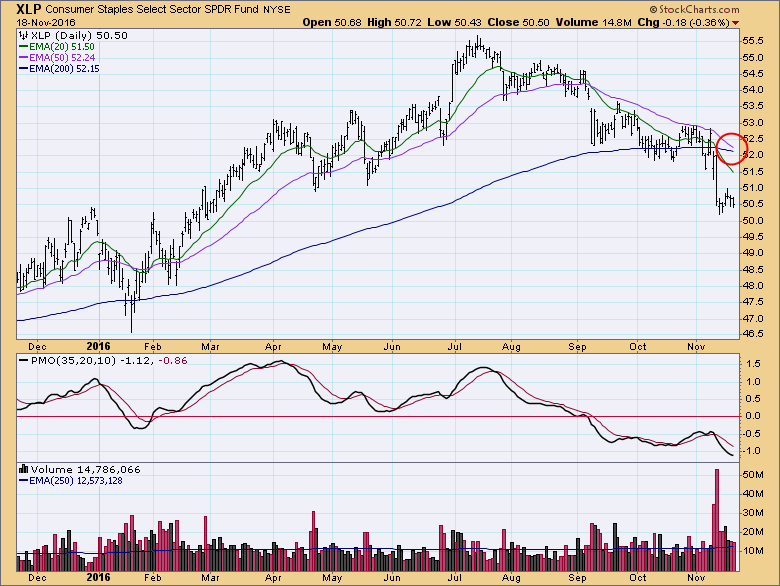
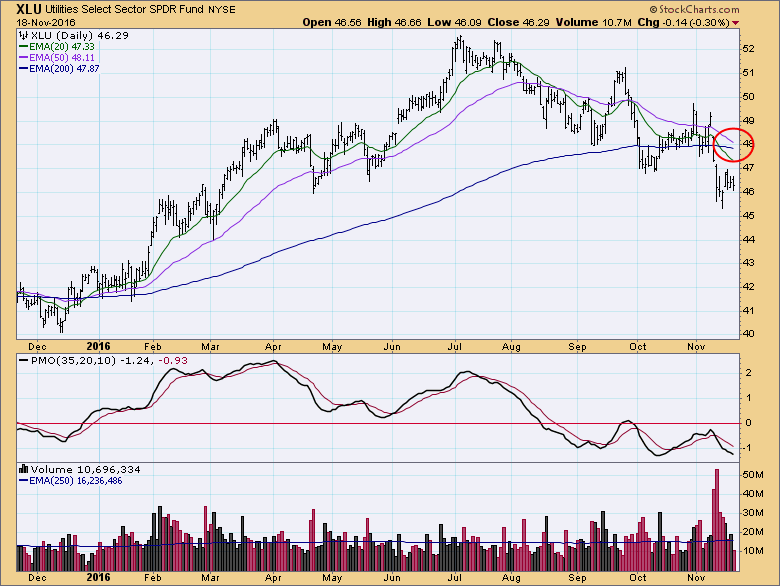
Of the ten S&P 500 sectors, two are in bear markets -- XLRE (above) and XLV (Health Care). There are also two of the 10 that are headed for negative crossovers: Consumer Staples (XLP) and . . .
. . . Utilities (XLU). Assuming that these two crossovers actually happen, forty percent of the ten S&P 500 sectors will be in bear markets.
To create our vast array of market and sector indicators, DecisionPoint tracks 564 large-cap stocks that compose the S&P 500, S&P 100, Nasdaq 100, and Dow 65 indexes. Of that group of stocks nearly a third (31%) are currently in bear markets.
CONCLUSION: The broad market indexes are generally experiencing strong bull markets and making all-time highs, but with a little effort we can see significant erosion below the surface. One reason that cap-weighted indexes can push higher while many of their components are retreating is that the larger-cap stocks carry the index. This type of situation can persist for a long time, but we need to remember that it is a lot like thin ice. Dangerous.
The NEW DecisionPoint LIVE public ChartList has launched! Click on the link and you'll find webinar charts annotated just before the program. Additional "chart spotlights" will be included at the top of the list. Be sure and bookmark it!
Come check out the DecisionPoint Report with Erin Heim on Wednesdays and Fridays at 7:00p EST, a fast-paced 30-minute review of the current markets mid-week and week-end. The archives and registration links are on the Homepage under “Webinars”.
Technical Analysis is a windsock, not a crystal ball.
Happy Charting!
- Carl


