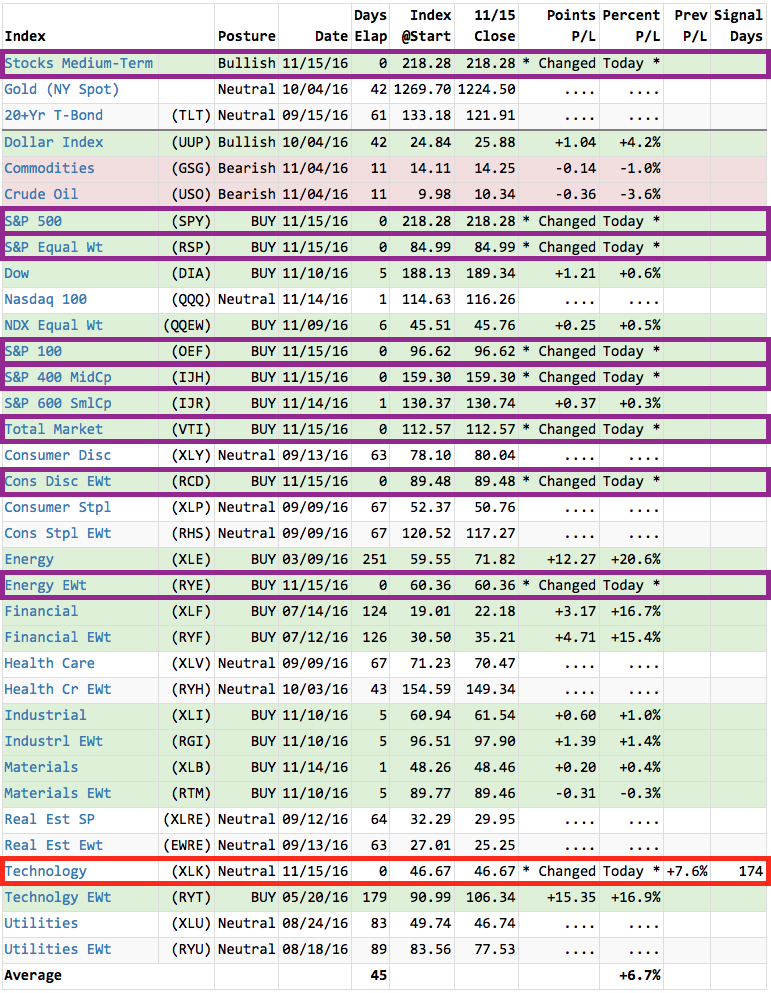
 With the post-election rally continuing to march ahead, only a few sectors are lagging; the majority, however, are moving to Intermediate-Term Trend Model (ITTM) BUY Signals. BUY signals are triggered when the 20-EMA crosses above the 50-EMA. The Market/Sector Summary posture table is located in the DP Reports blog that is available to members. I also publish it daily in the DecisionPoint Alert blog to set the stage for the analysis to follow. This table is a great tool to see quickly what sectors are performing and underperforming.
Investors play offense and defense using sector rotation. Typically, the technology sectors as well as consumer discretionary sectors are bull market darlings. However, a review of the DP Market/Sector Summary below shows that the SPDRs continue to lag and in fact, the Technology SPDR (XLK) generated a new Neutral signal just as others are picking up new BUY signals.
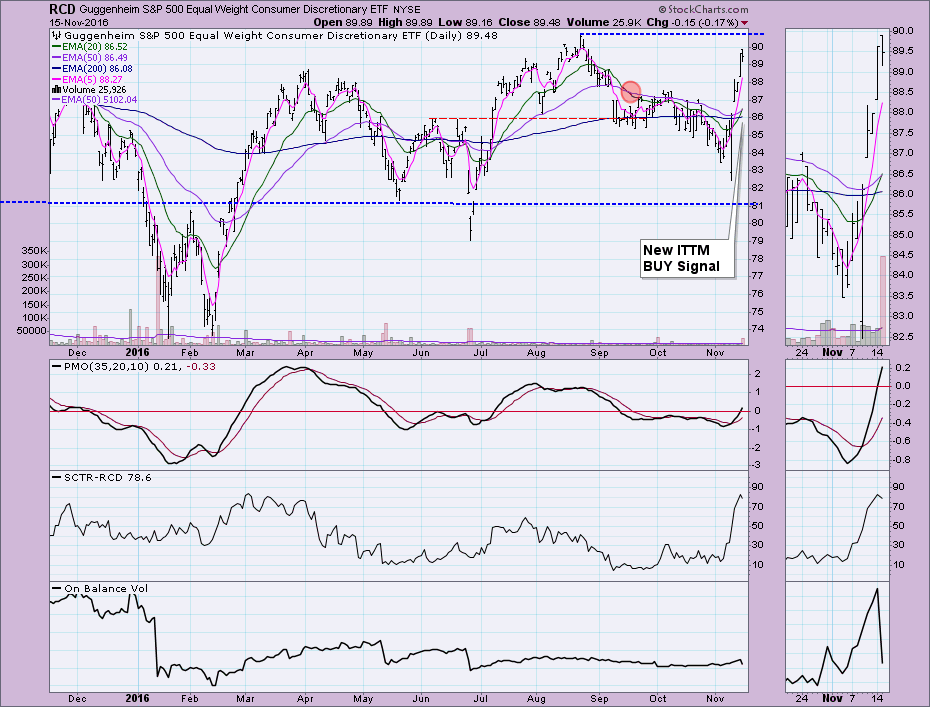
What's very interesting is that small caps are now participating in the rally even though the NDX and other technology-heavy or consumer services indexes and sectors are not. It's positive to see the Consumer Discretionary equal-weight ETF (RCD) moving to a BUY signal, yet it hasn't broken above overhead resistance. The chart looks good overall, but the OBV could use a shot in the arm. If anything, today's high volume decline is bearish.
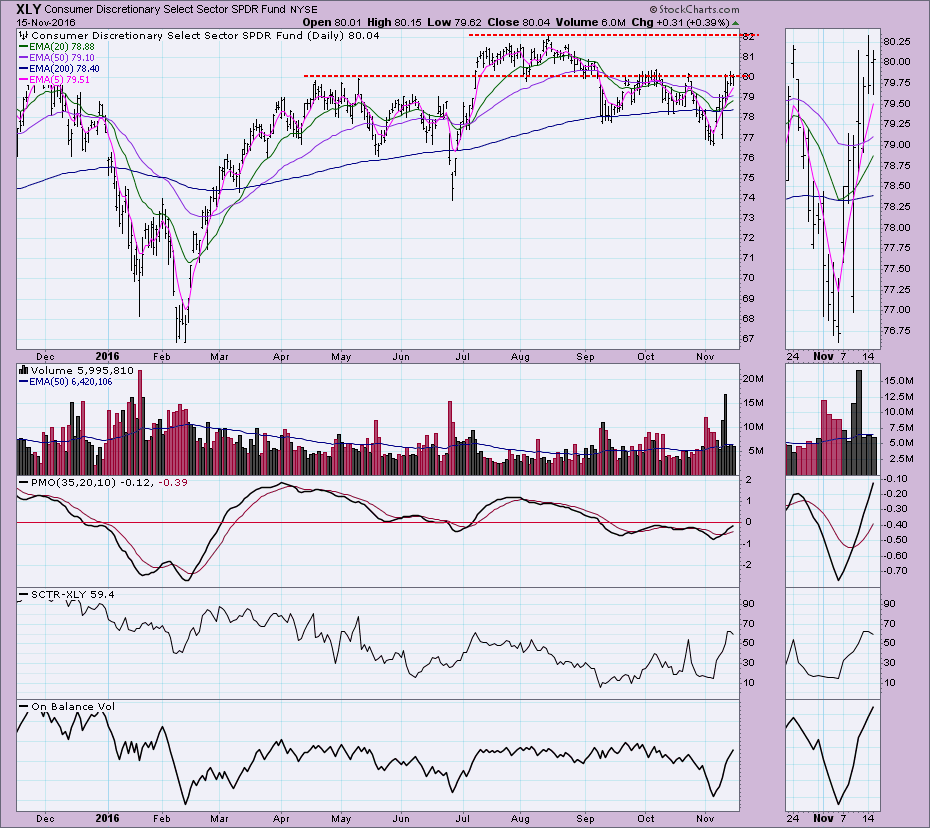
 The Consumer Discretionary ETF (XLY) is traveling in the right direction, but it is already being stopped up by overhead resistance at $80 instead of the high in August. The SCTR turning down before crossing above the 75 threshold is not inspiring. However, the 20-EMA is rising for a positive crossover the 50-EMA which would turn the current Neutral signal to a BUY. Resistance needs to be broken.
The technology equal-weight ETF (RYT) is holding onto its BUY signal that is over 179 days old. The RYT daily chart shows a breakout above record highs and a healthy SCTR. You could probably make a case for the development of an ascending triangle which is bullish.
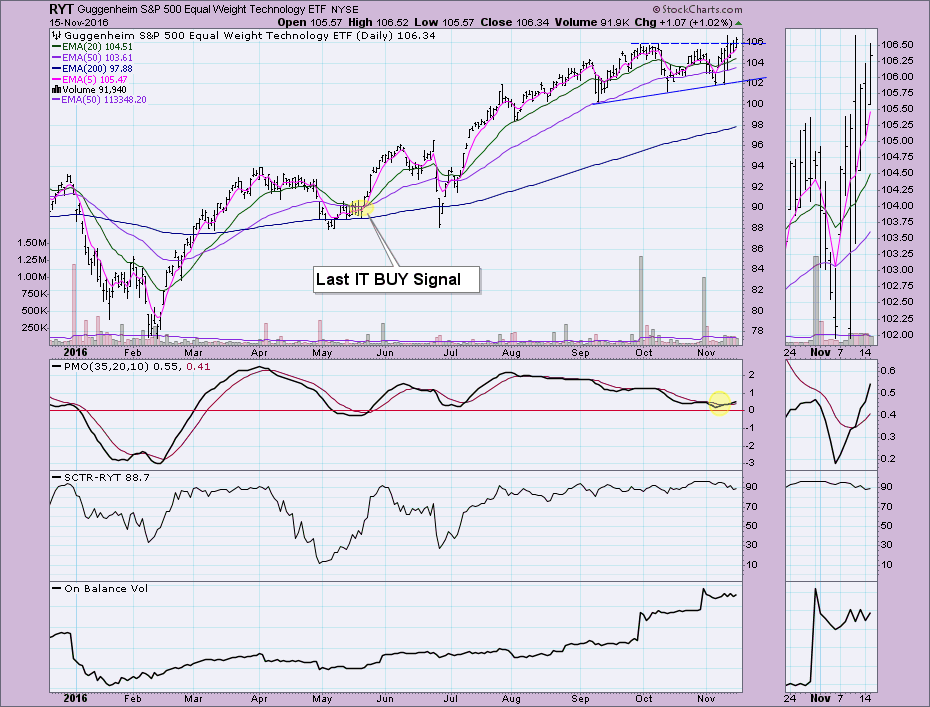 So what happened with XLK today or for the past week? Comparing this chart to the equal-weight Technology ETF (RYT), they barely look related. Clearly the highest cap stocks are holding the sector SPDR back. The Price Momentum Oscillator (PMO) is still declining and a new ITTM Neutral signal was just generated when the 20-EMA crossed below the 50-EMA while the 50-EMA was above the 200-EMA. Had the 50-EMA been below the 200-EMA, the signal would have been a SELL. (Neutral implying cash or fully-hedged, Sell meaning short)
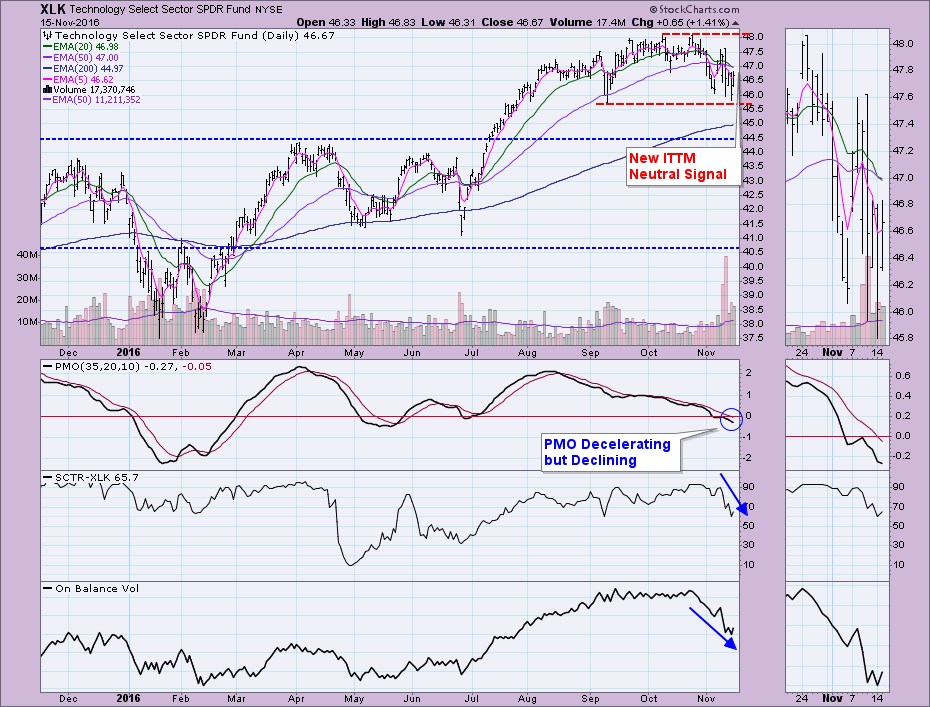 Conclusion: A new bull market that cuts above all-time highs is occurring in many sectors and indexes, but the NDX and its large cap members are weighing down the technology sector. A comparison of the equal-weight technology ETF (RYT) and the technology SPDR (XLK) seems to prove that point. The Consumer Discretionary sector ETFs are also split on their ITTM signals. Keep an eye on the DP Market/Sector Summary in the DP Reports blog or simply read my DP Alert message daily for your concise review of the market as well as Gold, Dollar, Oil and Bonds.
The NEW DecisionPoint LIVE public ChartList has launched! Click on the link and you'll find webinar charts annotated just before the program. Additional "chart spotlights" will be included at the top of the list. Be sure and bookmark it!
Come check out the DecisionPoint Report with Erin Heim on Wednesdays and Fridays at 7:00p EST, a fast-paced 30-minute review of the current markets mid-week and week-end. The archives and registration links are on the Homepage under “Webinars”.
Technical Analysis is a windsock, not a crystal ball.
Happy Charting!
- Erin

