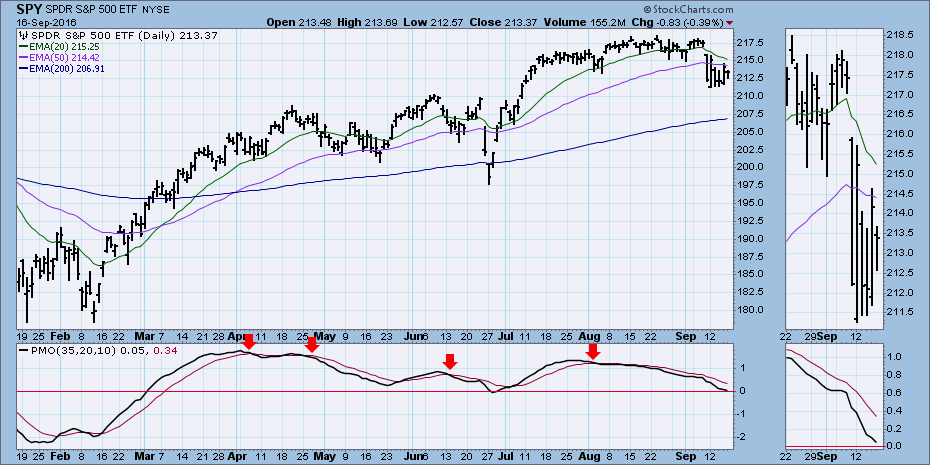
Before we ask if an oversold bounce is possible, we should ask if the market is oversold. Looking at the chart below, the PMO is just above the zero line. While that level proved to be oversold after the Brexit vote at the end of June, a more typical oversold reading is around -2.0, like it was in February. But maybe we can find another indicator that might offer some hope of a short-term bottom.
The indicator I have in mind is the Percentage of PMO Crossover BUY Signals for the S&P 500 Index. The PMO generates BUY and SELL signals when it crosses up or down through its signal line. On the chart above I have annotated the most recent PMO SELL signals, so that you can see what happens to price following those SELL signals. We are in a bull market, so the reaction is not very severe, but there is usually some show of weakness.
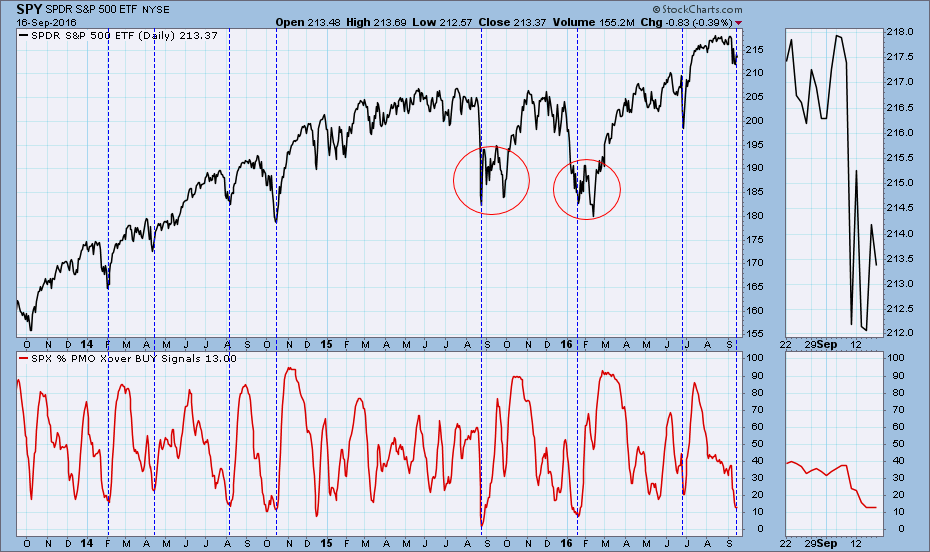
DecisionPoint tracks the PMO signals for all the stocks in the S&P 500 Index, and we chart the results on the chart below. Currently only 13% of SPX stocks are on PMO BUY signals. That means that 87% are on PMO SELL signals, and they are subject to further price deterioration.
On the other hand, the indicator is very oversold and is due to start moving up again as stocks begin to generate new PMO BUY signals. I should emphasize that this is a short-term indicator, and it moves fast and typically does not linger at such low levels; however, as a short-term indicator, it can relieve short-term oversold conditions fairly quickly.
I have marked several examples that illustrate what can happen when the indicator begins to rise. Again, these examples are taken from a bull market period, so we usually see some pretty good price advances. Two notable exceptions are the double bottoms in 2015 and again earlier this year. There were price bounces out of the extreme indicator lows, but the price lows were retested about a month later. Of course, we shouldn't assume that the indicator won't go any lower, but it is getting near the bottom of its normal range.
CONCLUSION: In the medium-term context, the PMO is not oversold at all. It is solidly neutral, as are other medium-term indicators (not shown). However, there has been enough selling pressure to reduce the Percentage of PMO Crossover BUY Signals down to 13%, and a short-term price bounce is probably not far away. The negative seasonality associated with September and October should temper any optimism generated by positive price movement.
ChartCon 2016 starts on Friday, September 23rd and runs thru the end of the day on Saturday, September 24th. It's an on-line conference. All you need to watch it is a computer and an Internet connection. Click here to register.
Technical analysis is a windsock, not a crystal ball.


