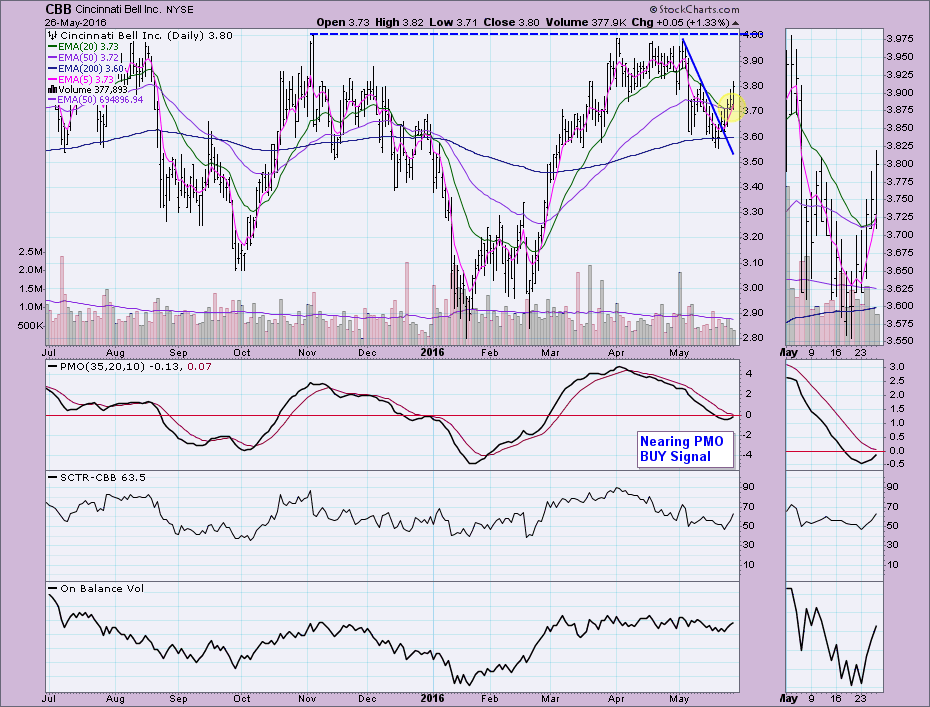
 With the market rallying and new Price Momentum Oscillator (PMO) signals moving to BUY signals, I decided to do one of my PMO scans. This particular scan looks for stocks/ETFs with PMOs that have been rising for three days and have just had a 5/20-EMA positive crossover today. Cincinnati Bell (CBB) caught my eye immediately with it's dependable price movement within a distinct trading range.
The breakout on the daily chart is impressive as are the Intermediate-Term and Short-Term Trend Models new BUY signals. The PMO is very close to a BUY signal as well. The SCTR and OBV are rising with this new rally. Overhead resistance is located around $4.00. I'm not expecting to see price rise too much past that resistance line given the characteristics of the weekly chart (shown below the daily chart).
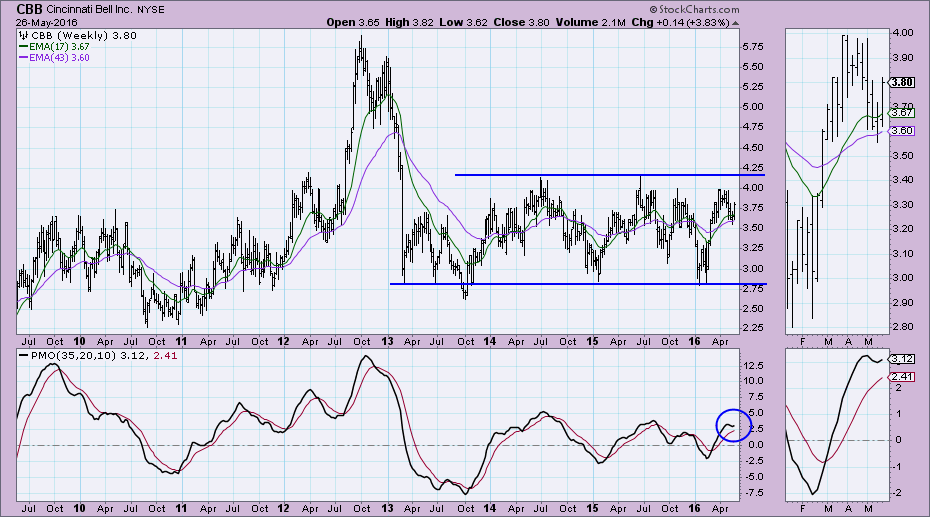
A rise to $4.00 would only be a stopping point on the weekly chart. The weekly PMO has turned up as did the 17-week EMA. Remember this chart will not go final until tomorrow, but I do believe it points out the steady price range of the past two to three years. A test of the top of the price channel is not out of the question and a move to $4.00 as called for on the daily chart is a reasonable expectation.
Conclusion: Upside potential for CBB is near $4.00 or more based on new Trend Model BUY signals and a long-term price range that has been intact for over two years. If price breaks above the trading range on the weekly chart, we could see a longer-term bull market for CBB. For now, a move to test the top of the long-term price range is called for.
Come check out the DecisionPoint Report with Erin Heim on Wednesdays and Fridays at 7:00p EST, a fast-paced 30-minute review of the current markets mid-week and week-end. The archives and registration links are on the Homepage under “What’s New”.
Technical Analysis is a windsock, not a crystal ball.
Happy Charting!
- Erin


