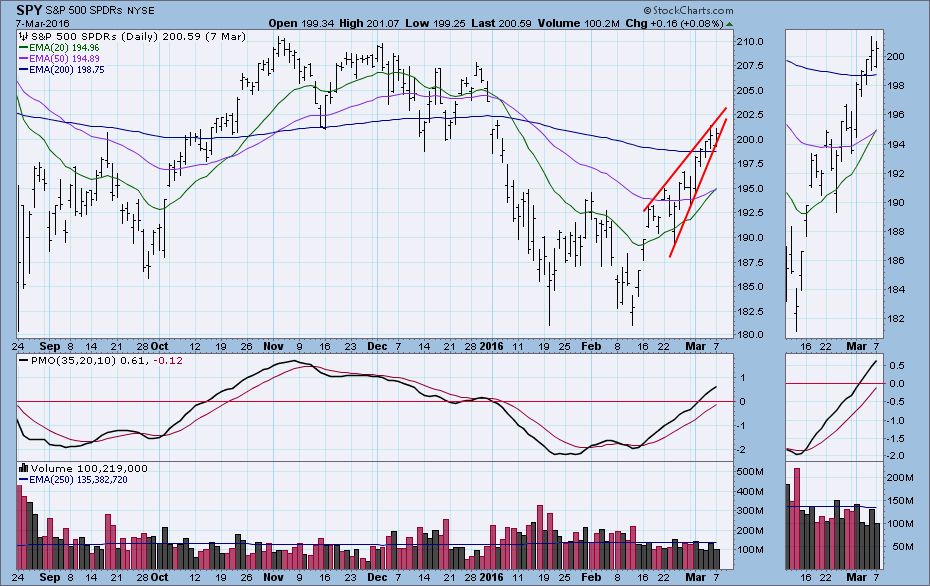
One of my favorite chart patterns is the wedge -- rising or falling -- because it can usually be depended upon to resolve opposite the direction the wedge is moving. Specifically, a rising wedge will usually resolve downward and vice versa. Recently I saw some wedges developing on the SPY chart that reinforced my bearish feelings about the rally off the February lows. They have resolved as expected, but bearish expectations have not been realized. Let's watch the evolution of the evidence.
On Monday the wedge formation I had been following looked like it was sure to break downward. The wedge was squeezing price to a point where something had to give, and, as a rule, the steepest line is usually the weakest.
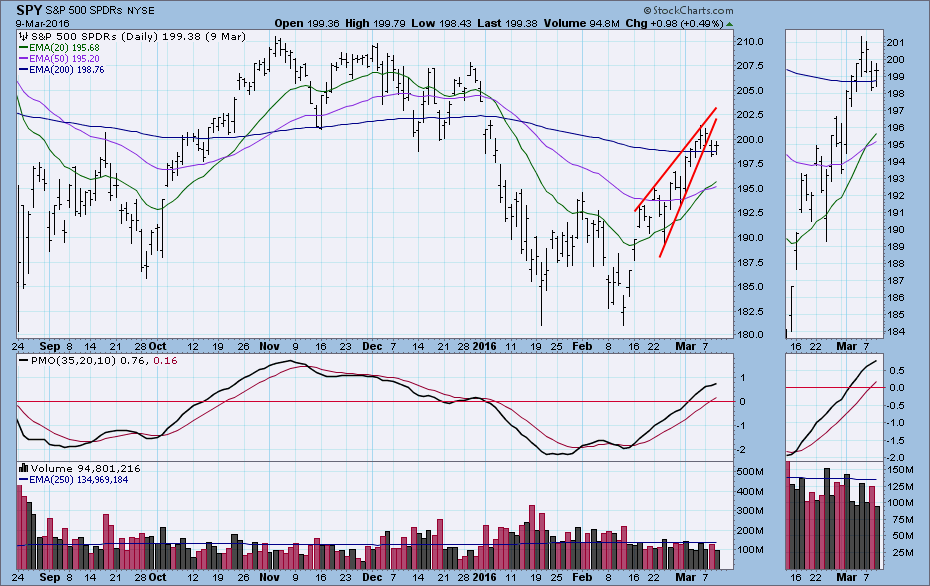
 Hah! I was right . . . but not elated, because there was no follow-through the day after the breakdown.
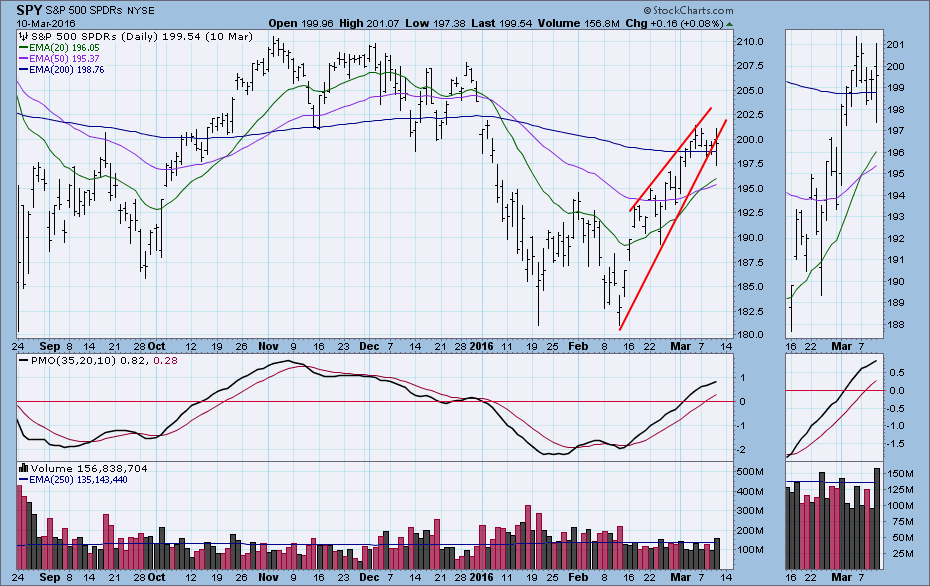
 But I noticed that a larger wedge emerged when I drew the rising bottoms line from the February low. Again the wedge resolved downward and hit a low for the week, but price bounced back to the line, making the breakdown somewhat dubious.
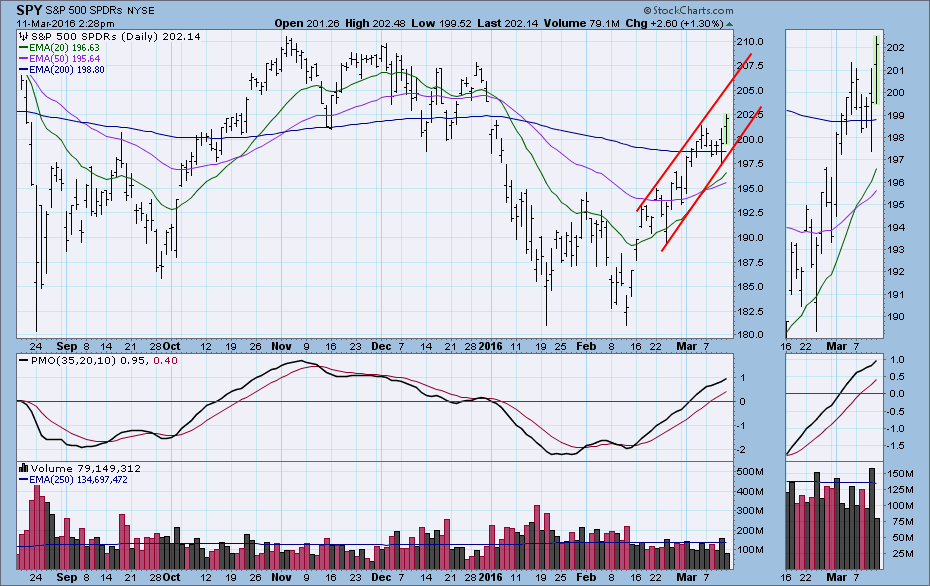
On Friday price rallied back into the wedge, making a higher high. Time to give up on the wedge. At this point I have realigned the rising bottoms line across the two most recent and prominent bottoms. Coincidentally, it is parallel with the rising tops line, and a rising trend channel has been formed. The top of the channel provides us with new technical parameters, helping us estimate how much farther price might rally before hitting technical resistance. Conversely, if price fails to reach the top of the channel before falling back to the bottom of the channel, that would be a strong sign that the rally is over.
SUMMARY: The rising wedges resolved as expected, but there was no downside follow-through to break the rally. This forced us to adjust to the new evidence and develop a new rationale befitting current market behavior.
Technical analysis is a windsock, not a crystal ball.

