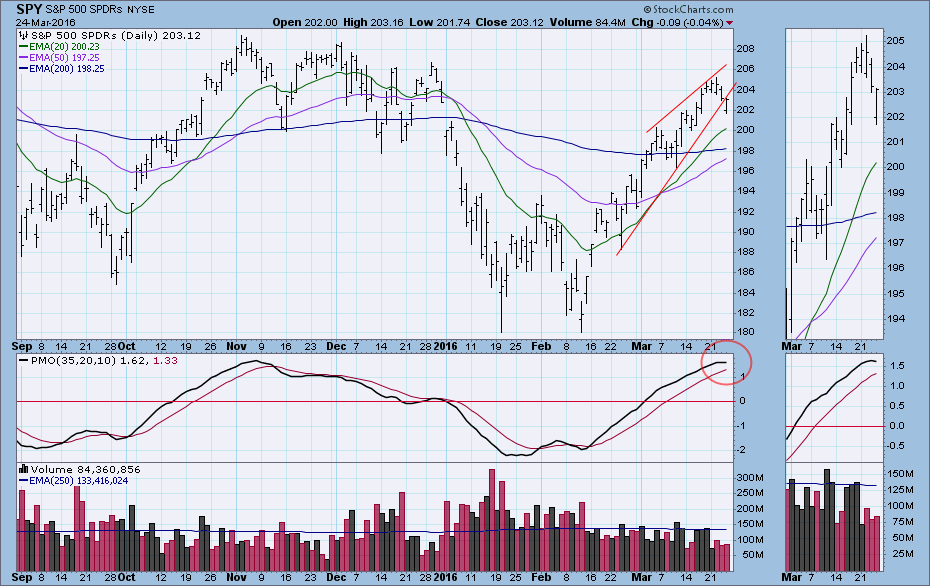
On Thursday SPY broke below a short-term rising trend line. This might not have been too big a deal, but there is other evidence that something more negative is developing. For one thing, we can see on the chart that the PMO has topped at an overbought level similar to the PMO top in November.
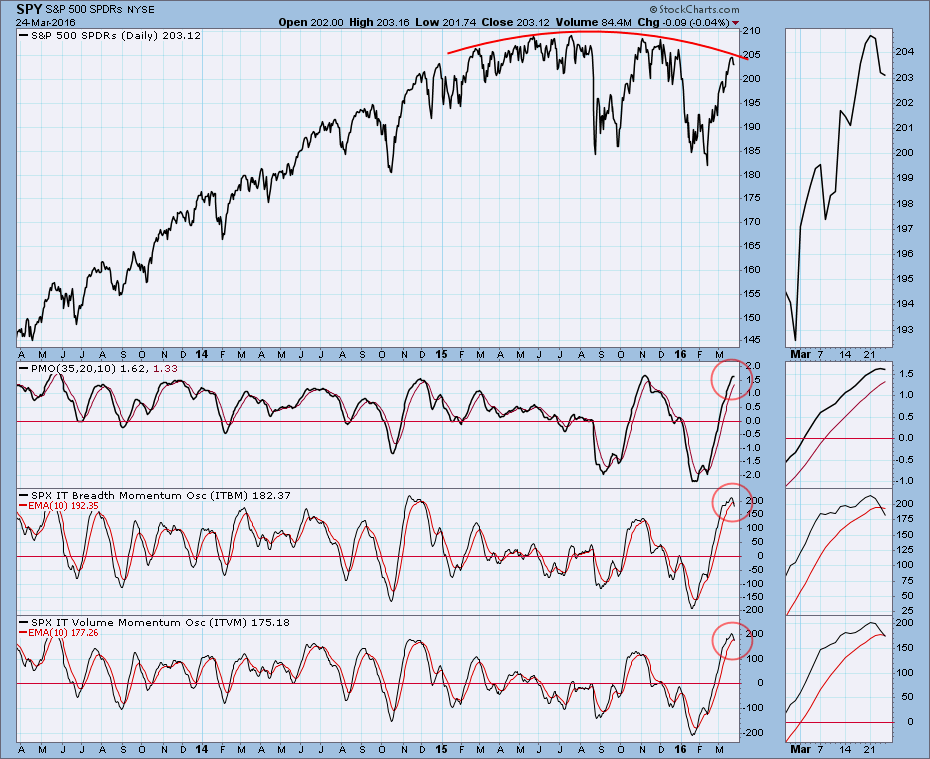
Zooming out to a three-year time frame gives us a better perspective, emphasizing that the current PMO reading is at the top of the normal range. The three DecisionPoint proprietary indicators shown are my primary intermediate-term tools. The PMO is derived from price, and there are also two other indicators on the chart -- one for breadth (ITBM) and one for volume (ITVM). We can see that they are also at the top of their normal range, and they have crossed down through their signal lines.
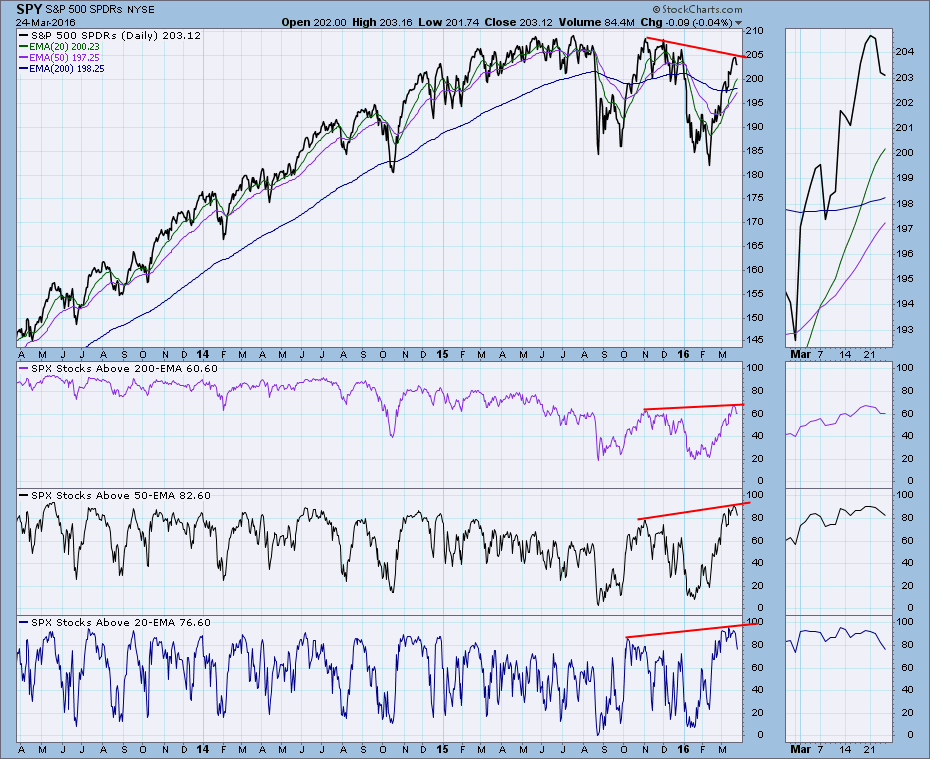
Another set of indicators I like to use shows us the percentage of stocks above their 20EMA, 50EMA, and 200EMA. These are price-based indicators that give us market condition in three different time frames. There is a reverse divergence on all three -- they have made higher tops compared to the lower top on the SPY chart. In spite of broad participation in the price advance, price is is not responding appropriately.
CONCLUSION: Internal indicators are very overbought, and price is showing some weakness. There could be some more churning to finally put in a top, but I think the next significant intermediate-term move will be to the downside.
Technical analysis is a windsock, not a crystal ball.


