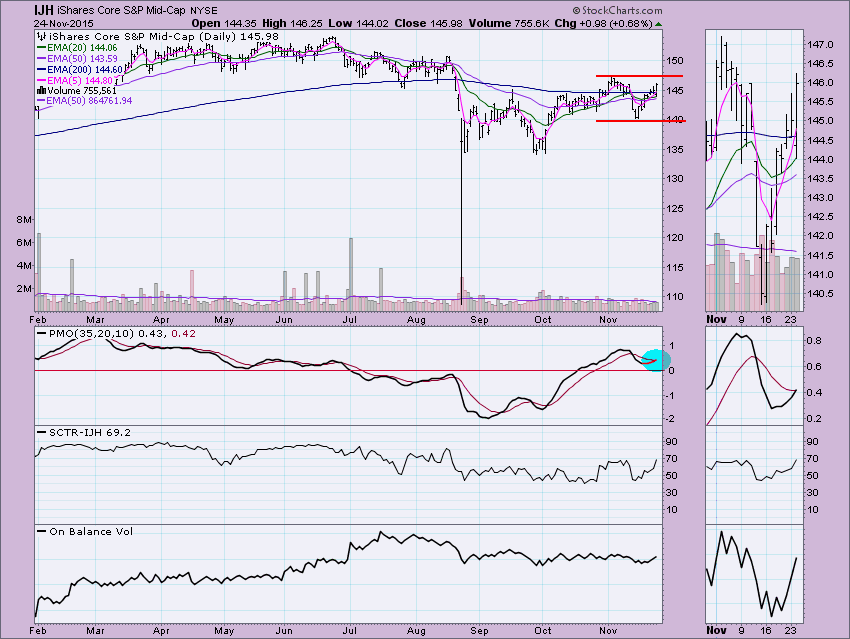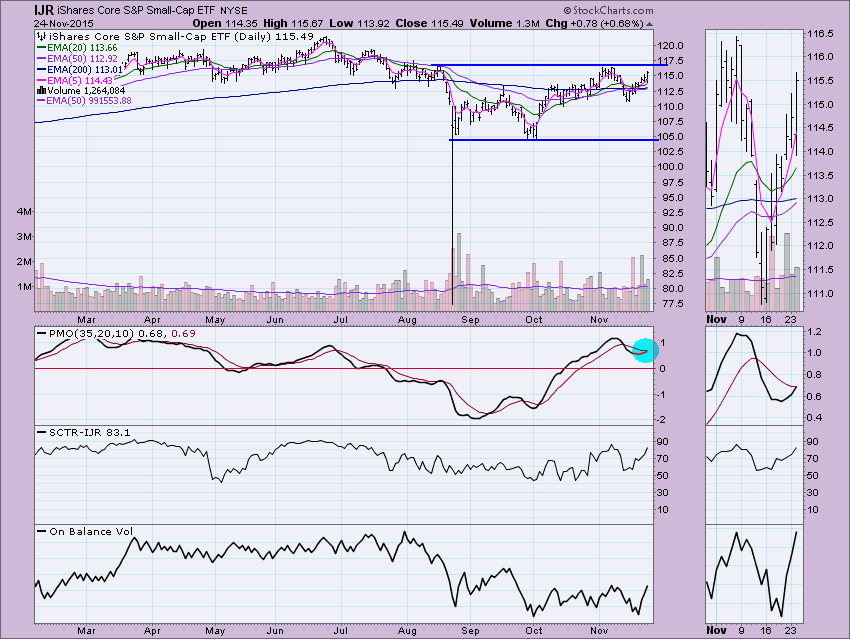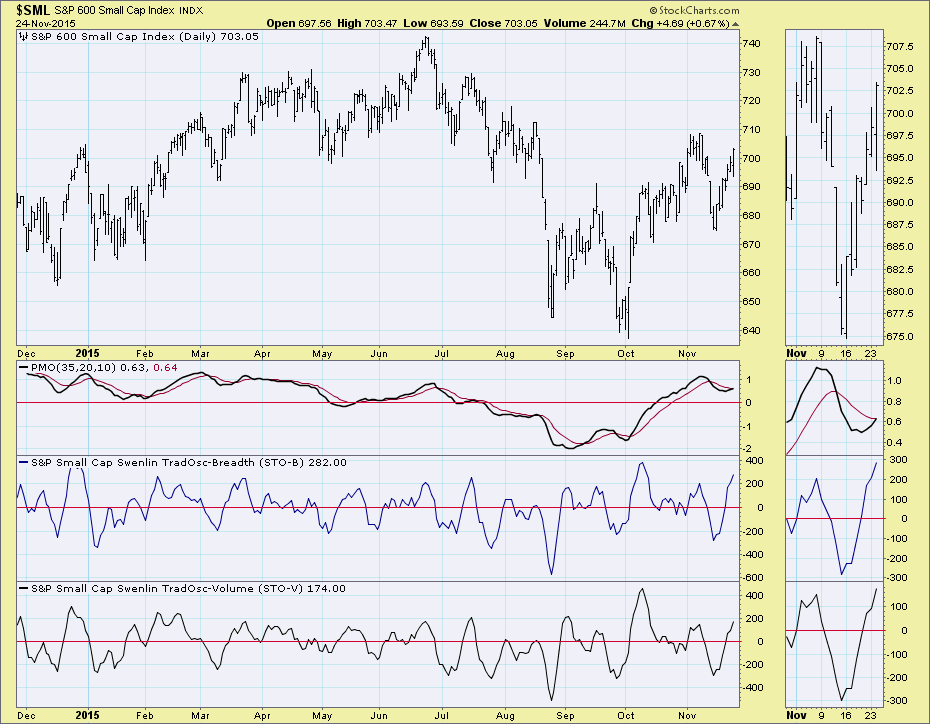
Interestingly, small- and mid caps received Price Momentum Oscillator (PMO) crossover BUY signals before the large cap indexes. In last weekend's ChartWatchers article I pointed out how all of the major indexes had little to no momentum during this rally. The PMO readings had been flat throughout the current rally and not had positive crossover BUY signals. If you check out the DP Chart Gallery, you'll see that all of the four major indexes are still on PMO crossover SELL signals in the short term. They are nearing positive crossovers; their PMOs are all rising but very very slowly.
The S&P 400 ETF (IJH) had its positive PMO crossover today and the S&P 600 ETF (IJR) is only one one-hundredth of a point away from the same. Volume has been behind the rallies that are still happening for these indexes. Although momentum is positive and rising, the crossovers are in overbought territory which could be a problem. Overhead resistance is near at the November high. If they can breakout, a move to the all-time highs is quite possible.
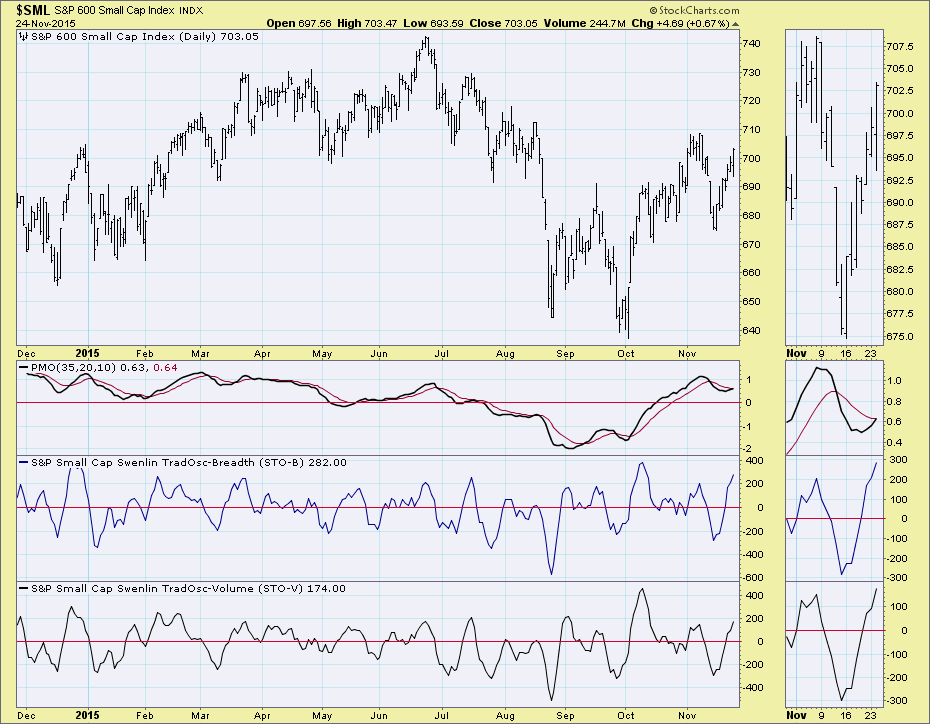
The Swenlin Trading Oscillators are in overbought territory and vulnerable to a top. There is room to rise. When they do turn down, it doesn't always mean that a decline is necessary to move them into neutral or oversold territory, consolidation will also work.
The S&P 500 and 100 are topping as intraday highs move lower rather than higher. The concern is whether mid and small caps are leading or lagging. They have been in the same rally that the other indexes have been in that appears to be exhausting. Price is nearing overhead resistance on all of the charts, small-, mid- and large-cap. Remember, these charts are short-term, meaning days, a pullback would likely be shallow as support at the November low looks strong.
Come check out the DecisionPoint Report with Erin Heim on Wednesdays and Fridays at 7:00p EST. The archives and registration links are on the Homepage under “What’s New”.
Technical Analysis is a windsock, not a crystal ball.
Happy Charting!
- Erin


