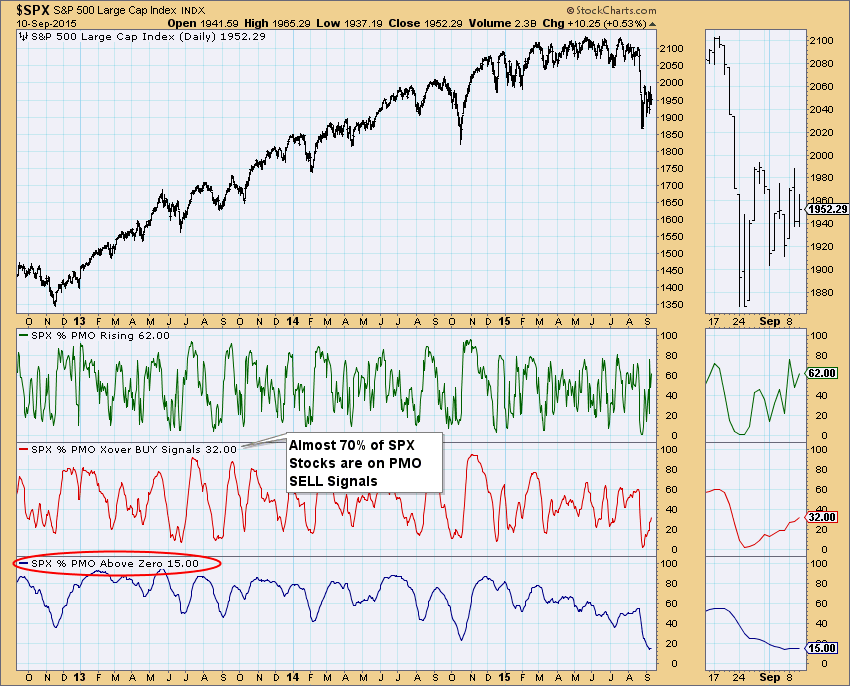
I think most are in agreement that we are now in a bear market. As far as DecisionPoint models are concerned, we definitely are. When the 50-EMA crosses below the 200-EMA, we consider that ETF/Stock/Index/MF to be in a "bear market". To be successful, we need to invest with the current trend. If you buy in a bear market environment, your chances of picking a "winner" decrease significantly. To prove my point, take a look at the Price Momentum Oscillator (PMO) Analysis chart from the DecisionPoint Chart Gallery. Almost 70% of the S&P 500 stocks are on PMO SELL signals. Worse is the percentage of stocks that have a PMO sitting in positive territory, only 15%! Why look for buying opportunities when you can scan for shorting opportunities?
There are a variety of scans you could come up with to find these shorting opportunities. Today I'll show you how to find stocks that are topping but haven't quite had a PMO crossover SELL signal. This scan is similar to the scans I have presented in the past using the PMO, only this time we have reversed our criteria. My scan is below. I've added comments so you can identify where you could tweak it to suit your needs. I've double-checked the syntax and results, you can copy and paste this into a new scan, including the comments.
# Choose what group you wish to scan
[group is SP500]
# A PMO that is currently on a BUY signal. You could reverse this if you want.
AND[today's PMO Line(35,20,10) > today's PMO Signal(35,20,10)]
# PMO top. PMO reading is less than yesterday, but the previous two days had been rising.
AND [today's PMO Line(35,20,10) < yesterday's PMO Line(35,20,10)]
AND [yesterday's PMO Line(35,20,10) < 2 days ago PMO Line(35,20,10)]
# Stock is in a bear market - 50-EMA is less than 200-EMA
AND [today's ema(50,close) < today's ema(200,close)]
# Stock is intermediate term Neutral or SELL
AND [today's ema(20,close) < today's ema(50,close)]
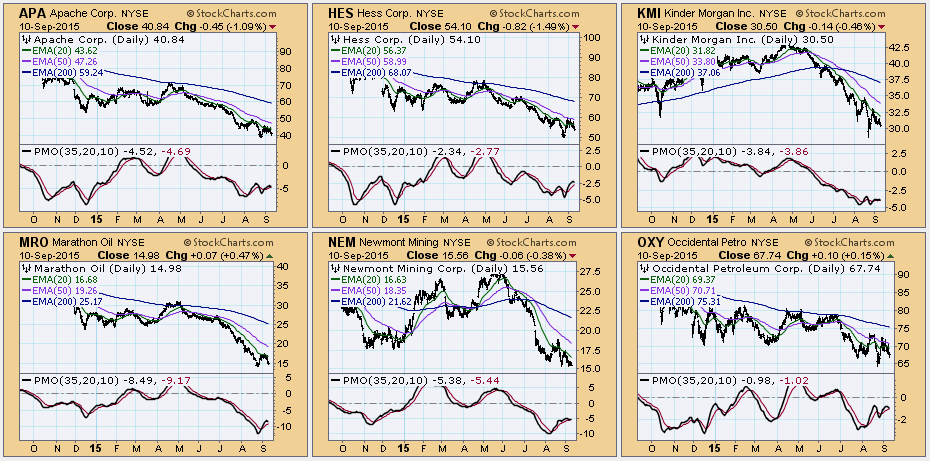
Here are the results in CandleGlance view.

All of these stocks are particularly weak. I would recommend reviewing the charts in a longer time frame to determine if the PMO is very oversold. A topping PMO in oversold territory is very bearish, but if it has already hit extremes, it suggests a reversal not a continuation of the current decline. I caution you on picking buying opportunities this way because as I said before, I cannot recommend buying into a bear market. Kinder Morgan (KMI) is an example of an oversold PMO topping. The one I find most interesting of those above is Occidental Petro (OXY). Even from the small CandleGlance chart you can see a bearish double-top formation. The PMO topped below the zero line and has room to decline further which is very bearish.
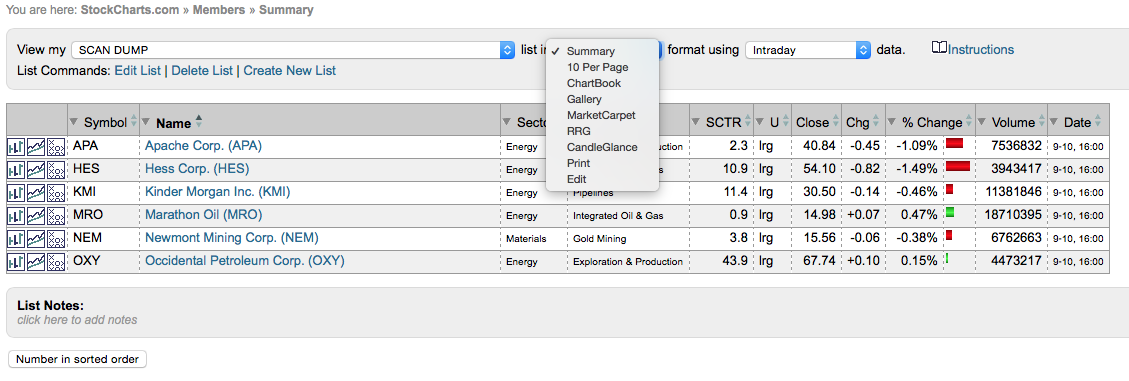
You can duplicate my CandleGlance charts above by saving your scan results to a ChartList and then from "view your list" choose "CandleGlance". If you want to know more about how to adjust your CandleGlance ChartStyle, here's an article that will help you. For more information on using CandleGlance and the PMO, you can review my article "PMO + CandleGlance = Smart Money".

Conclusion: It isn't prudent to invest against the overall market trend. Right now we are in a declining trend and bear market. It's time to look for shorting opportunities, not buying opportunities. The PMO scans are amazingly helpful in finding these shorting opportunities. Remember, I only used a scan for the S&P 500, you can choose any number of domains to scan to further refine or expand your results.
Technical Analysis is a windsock, not a crystal ball.
Happy Charting!
- Erin

