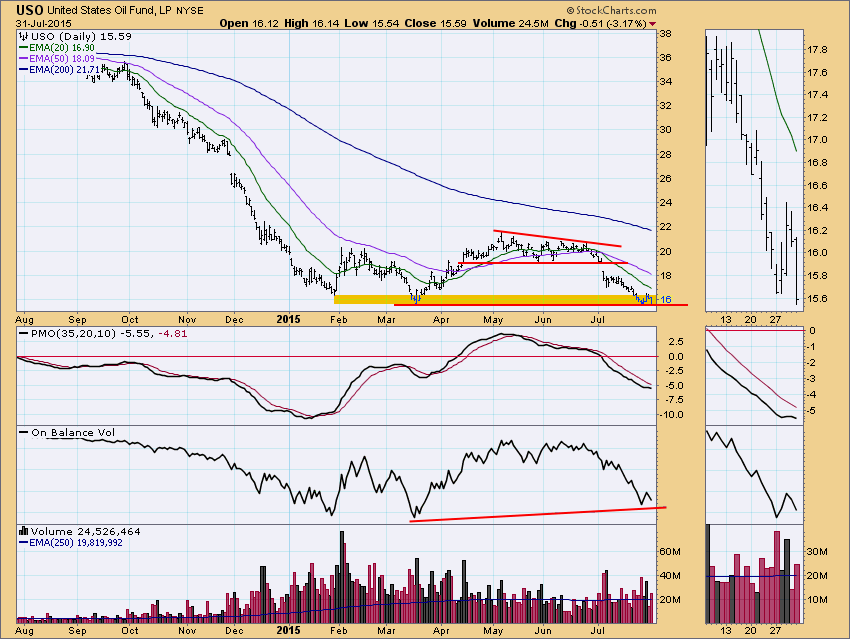
The price of crude oil is certainly getting a lot of headlines, but, as usual, we need to look at some charts to get the true picture. Our surrogate for crude is the U.S. Oil Fund ETF (USO), which reflects the price of oil less the costs of actually rolling over the contracts. Currently, USO is testing the low set in March for the second time this month, during which time it has been restrained within a support zone defined by the lows set in January and March of this year. The bottom of that support zone is on the verge of failure.
On a positive note we can see that the current test of support is occurring on lower volume than the first test this month, and the recent OBV low is higher than the OBV low in March, forming a positive divergence. But on the negative side we can see the PMO is topping below the signal line and the zero line, and I'm afraid I side with the negatives in this case.
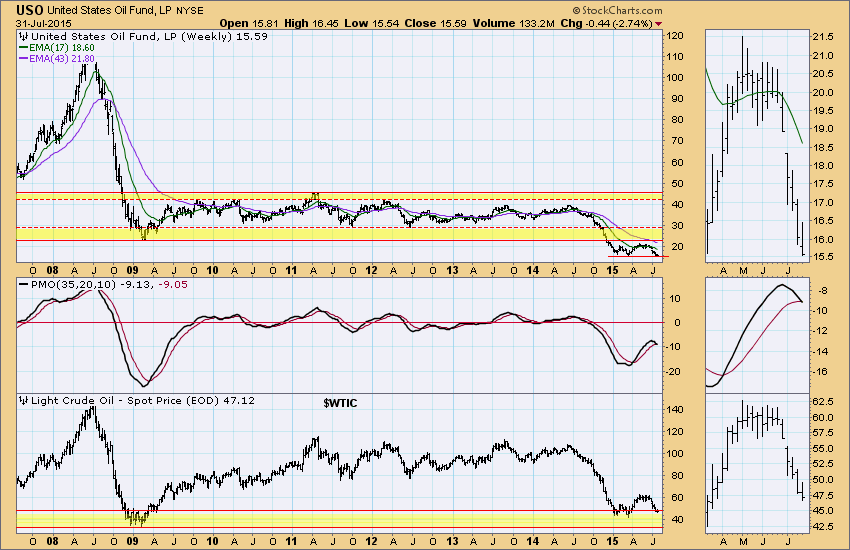
Looking at the weekly chart we can see that USO has fallen below the line of support drawn across the 2009 low, and the weekly PMO for USO is on the verge of crossing down through its signal line; however, $WTIC, which reflects the cost of the near futures contracts, is still at the top of a range of support.
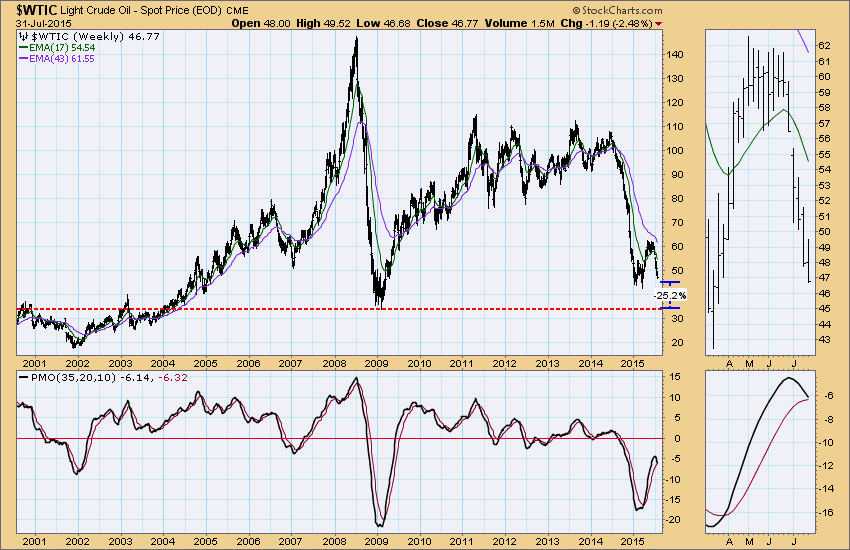
Looking at $WTIC by itself, we can see that it will take a decline of about -25% to reach the 2009 support level, which is about as far down as I would like to consider at this time.. A similar decline for USO would put the price at about $11.50.
The weekly PMO for $WTIC is also on the verge of a downside crossover, which is not encouraging.
Conclusion: There is not enough historical data on USO to look for support below the 2009 low, but, if $WTIC finds support at the 2009 low, it reasonable to assume that USO will find support at the same time at approximately $11.50.
Subscribe to Carl's free blog and receive email whenever a new article is posted. See subscription links at the upper right corner of this page.
Technical analysis is a windsock, not a crystal ball.


