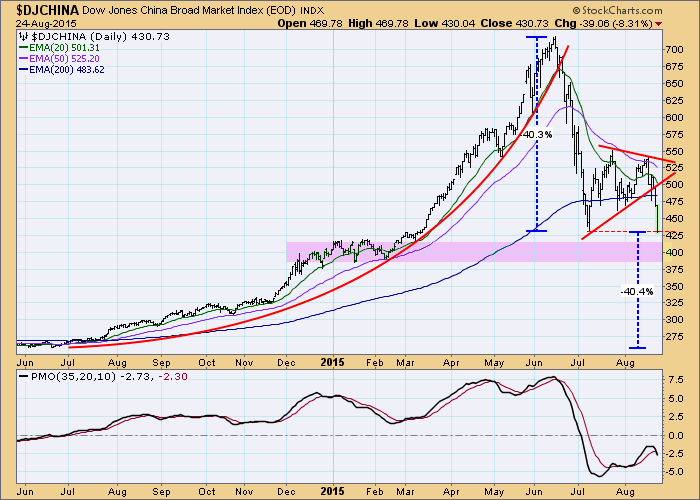
In early August I wrote an article about China's stock market crash, wherein I stated, "It is incomprehensible to me that such action in China will have no effect elsewhere in the global financial markets." Actually, it has been having effect on global markets, and last week reality finally hit the U.S. markets. Today China's market dropped another -8.31%, breaking down from a bearish reverse pennant formation, and hitting the July lows. This action is part of a breakdown from the parabolic rise that preceded the June price top. The expectation for these kinds of events is that price will return to the price base from which the parabolic emerged, which in this case, gives us a target decline of another -40% from current levels. There is no guarantee, of course, but it gives us a context with which to evaluate future market action.
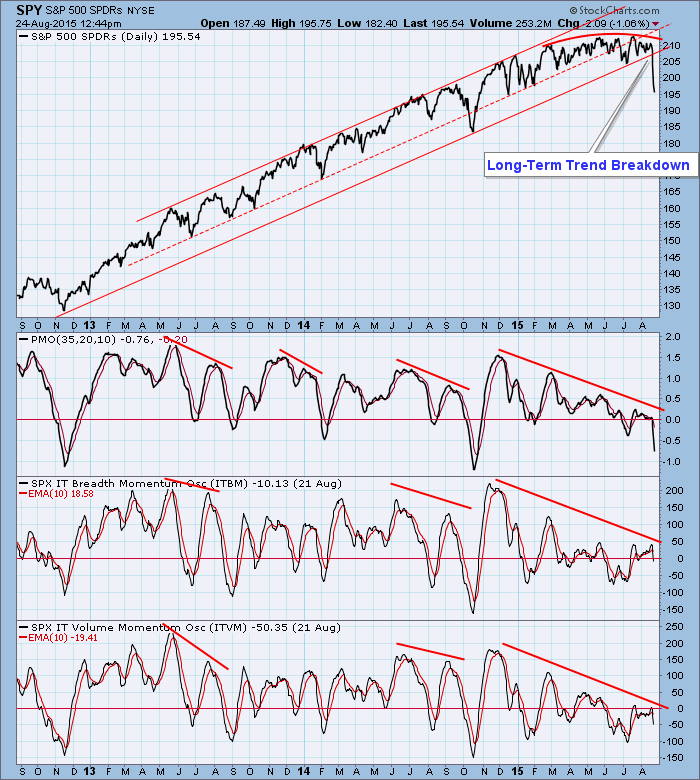
The following chart shows how the U.S stock market managed to resist following China's crash until last week, at which point a major rising trend line was broken. The break was not unexpected because three of DecisionPoint's primary indicators have been showing ever-worsening negative divergences for many months. I have also annotated some shorter-term negative divergences, which resulted in small corrections that were able to bring the internals and externals back into balance. The sharp correction we are now experiencing is helping to get prices to become more in alignment with reality.
Conclusion: China has led global markets into a bear market, and the trend has finally caught up with us. While I have concluded that we have entered a bear market, this has not yet been confirmed by a 50/200EMA downside crossover for SPY. The last eight months on the indicator charts shows a classic case of the market's foundation being undermined to the point that it ultimately drops into a sink hole. I have been faked out not a few times by this bull market, but I think this latest break is the end of the line for the bull cycle. Oversold conditions in a bear market are more dangerous than in bull markets because they often present extraordinarily weak conditions, rather than the kind of compression that launches rallies. I am expecting to see readings on the three above indicators at least equal to the October correction, but more extreme readings (-250) are possible before we see a sustained bounce.
Subscribe to Carl's free blog and receive email whenever a new article is posted. See subscription links at the upper right corner of this page.
Technical analysis is a windsock, not a crystal ball.


