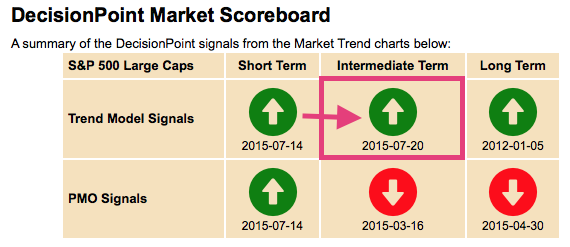
It's nice to be back from vacation (if you call driving your daughter from Auburn, AL to California with a trailer attached to a small compact car in three days, a vacation) and see the market begin to make all-time highs again. Today we had a DecisionPoint Scoreboard update on the S&P 500. An Intermediate-Term Trend Model (ITTM) BUY signal was generated. The last two bearish signals are for the Intermediate-Term Price Momentum Oscillator (PMO) and Long-Term PMO signals. These are generated from the weekly and monthly charts respectively.

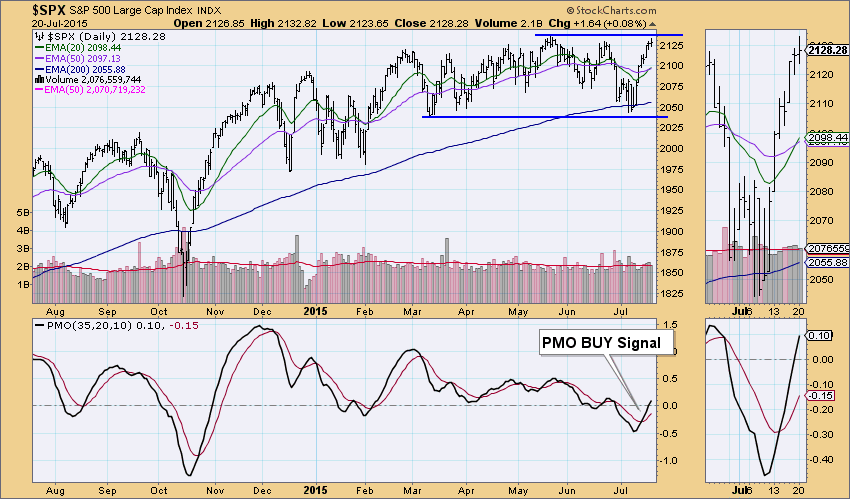
Here's a copy of the daily chart that is in the DecisionPoint Chart Gallery for $SPX. Unlike the SPY, $SPX has not reached all-time highs yet. A new ITTM BUY signal was generated as the 20-EMA crossed above the 50-EMA. Price is now going to attempt a break above resistance. With the SPY already accomplishing this milestone, I believe it will happen on the $SPX.
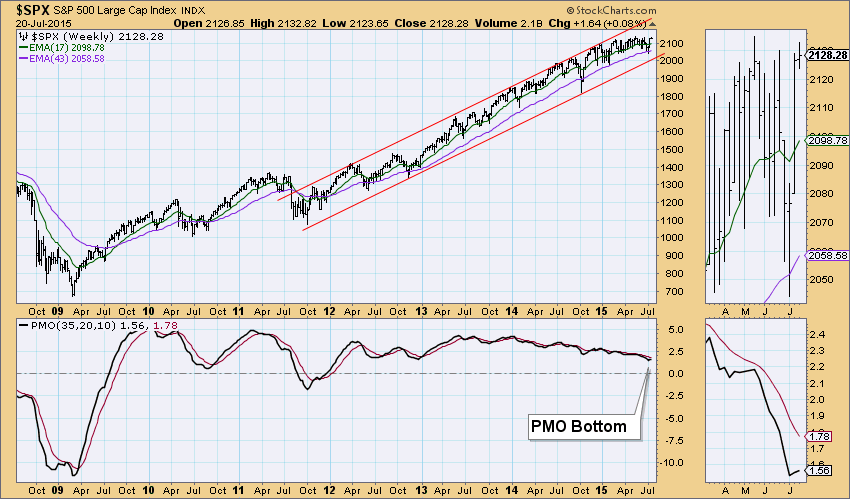
What will it take for the IT PMO and LT PMO signals to switch bullish? For this we have to look at the weekly and monthly charts. On the weekly chart, the PMO has bottomed, but does have some distance to cover. These moves are generally sluggish when price is consolidating sideways like it is now on the weekly chart.
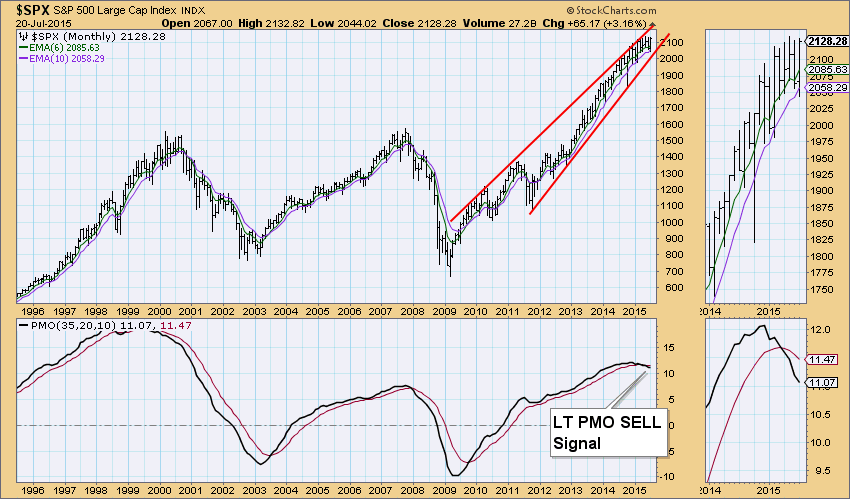
On the monthly chart, the LT PMO is in the same situation as the IT PMO. It's on a SELL signal but has some distance to cover to cross back over its signal line. It is still falling unlike the IT PMO.
Take a look at my article in the DecisionPoint Alert today on the SPY. Short-term indicators are starting to show weakness and could be telling us that staying at or above all-time highs will be difficult. In the meantime, keep an eye on the DecisionPoint Scoreboard located in the DP Chart Gallery.
Technical Analysis is a windsock, not a crystal ball.
Happy Charting!
- Erin


