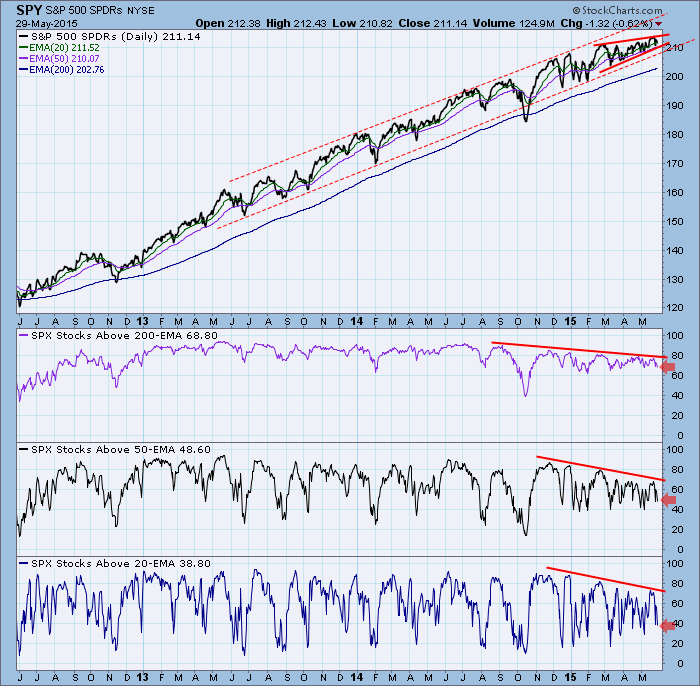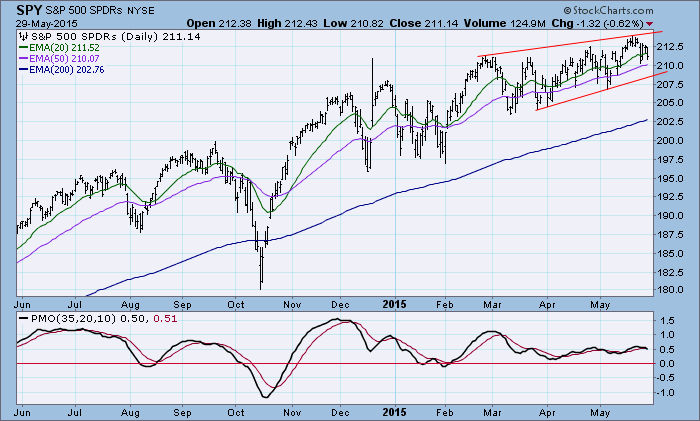
Last week I pointed out in my article that the SPY price chart had a bearish rising wedge pattern, and that there were negative divergences on various medium-term indicator charts. This week we can see that the rising wedge remains intact, but the expectation is that it will resolve to the downside. We can also see the persistent negative divergences on another set of indicators--the percentage of stocks above their 20EMA, 50EMA, and 200EMA. This set of indicators give us a look at short- ,medium-, and longer-term internals. And, while the market remains near all-time highs, the indicators show greatly diminished support for prices in all three time frames.
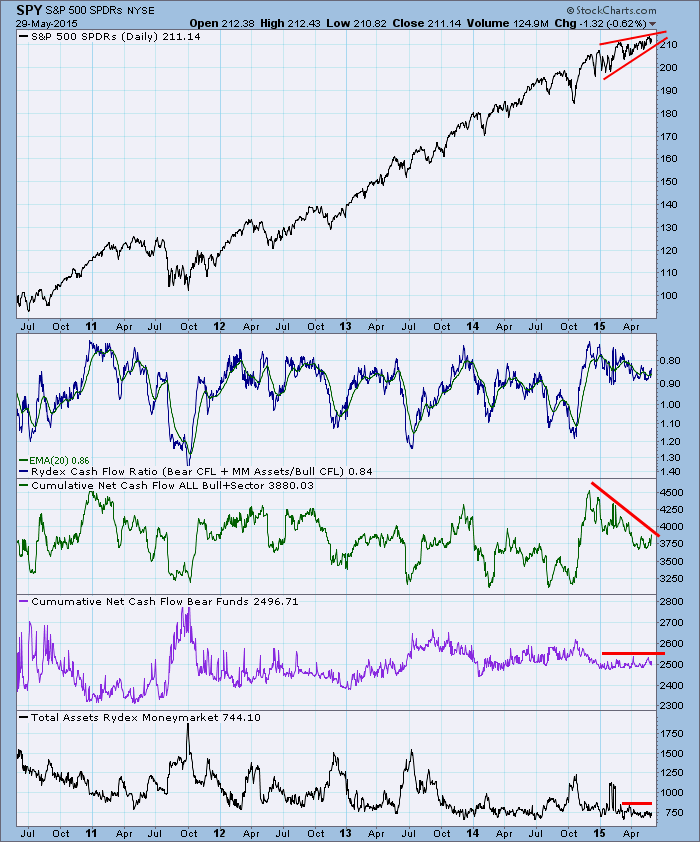
Another indication that price is being undermined are seen on the Rydex Cash Flow charts. In particular, we can see that cash flow for Sector and Bull Index funds has been moving in a negative direction since the end of last year. People are not moving to bear funds, but it is rather like they are quietly moving toward the exits.
Our timing models are driven strictly by price derivatives, specifically, moving averages, and we can see that the 20EMA, 50EMA, and 200EMA are positively stacked. This has us in a bullish posture, appropriately so because price is trending upward.
Conclusion: While price performance is positive, internal indicators show us that the rising price trend is being undermined. A rising wedge pattern will normally resolve to the downside. If that happens, the weak internals could prevent a speedy recovery from the break, and result in deeper correction than we are used to. I do not believe that this calls for being short the market. We could be looking at a final bull market top, but there is no way to know that. To be sure, I have been looking for that final top about two or three years.
Technical analysis is a wind sock, not a crystal ball.


