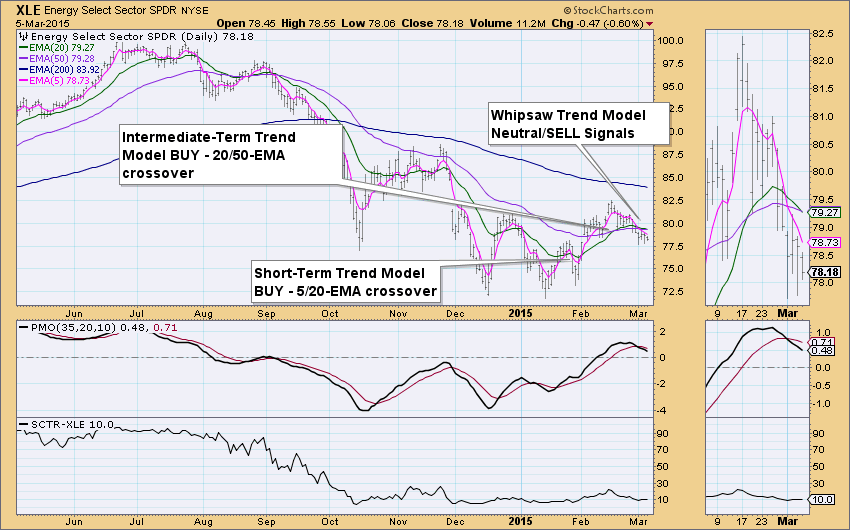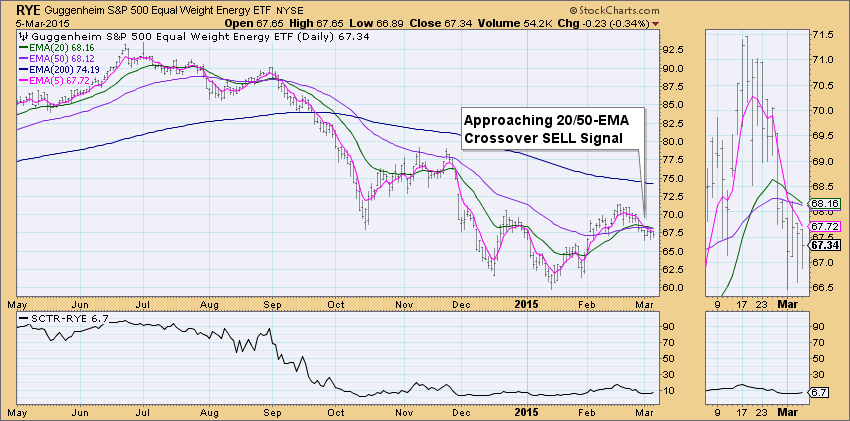
On February 19th I wrote a blog article on the Energy Sector and its possible resurgence as both the Energy SPDR (XLE) and the equal-weighted sister Rydex Energy ETF (RYE) had gone on Intermediate-Term Trend Model BUY signals following Short-Term Trend Model BUY signals. Well, it's lights out for XLE as the Intermediate-Term Trend Model generated a SELL signal. RYE is close behind with the Trend Model only 4 one-hundredths of a point away from a SELL signal.
It appears that these Trend Model BUY signals were late to the party. Looking at the chart for XLE we see the whipsaw move of the 20-EMA shortly after its positive crossover. Even the 5-EMA, which is fairly responsive in the short term, took its time before its negative crossover the 20-EMA (clearer in the thumbnail). About the same time the 5-EMA crossed below the 20-EMA generating a Short-Term Trend Model Neutral Signal (the 20-EMA was above the 50-EMA at the time of the crossover so it is a Neutral not SELL) the Price Momentum Oscillator (PMO) had a negative crossover its EMA in overbought territory which was the first sign there was a problem.
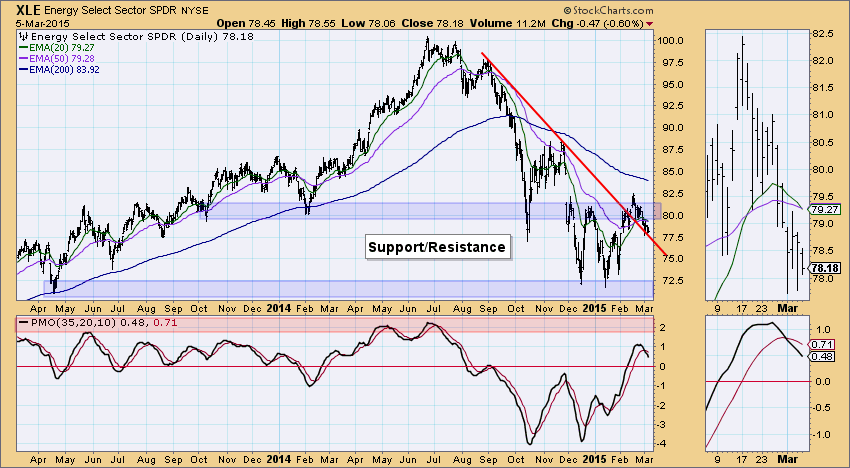
Looking at a longer term daily chart, we see that price has been charging between longer-term areas of support and resistance. Probably the only positive aspect of this chart is that price is staying above the declining tops trend line. It's also clear on this chart that the PMO is indeed overbought.
RYE looks very similar, though we can see that the 20-EMA has not yet crossed below the 50-EMA (visible in the thumbnail). It is likely it will happen tomorrow unless price can somehow move above the 20/50-EMAs in one day. Notice also that the SCTR values for RYE and XLE above, have been in the basement since October of last year.
A trip down to support levels near the January lows seems a reasonable expectation for both XLE and RYE at this point.
Happy Charting!
Erin


