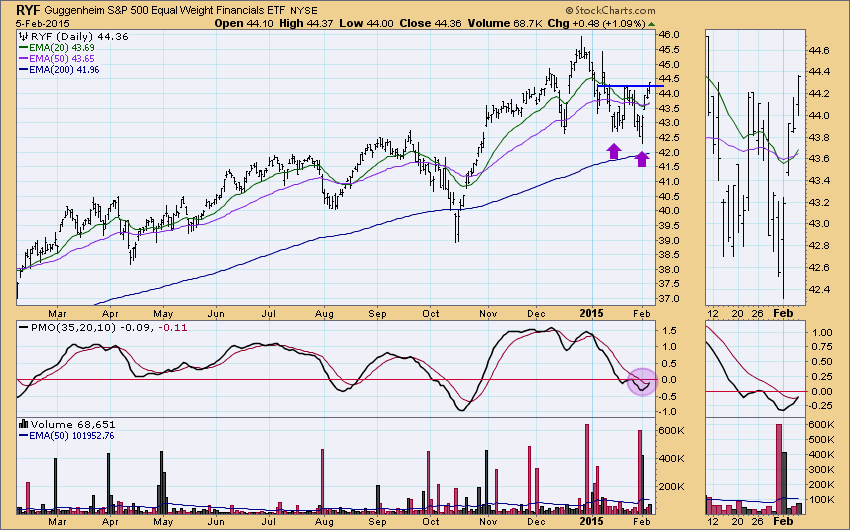
 When I took a look at the DP Alert Daily Report today, I noticed it had some important Price Momentum Oscillator (PMO) crossover BUY/SELL signals that you should know about. Additionally, the DecisionPoint Intermediate-Term Trend Model generated a BUY signal on the equal-weighted Financials ETF (RYF) and that chart looks great.
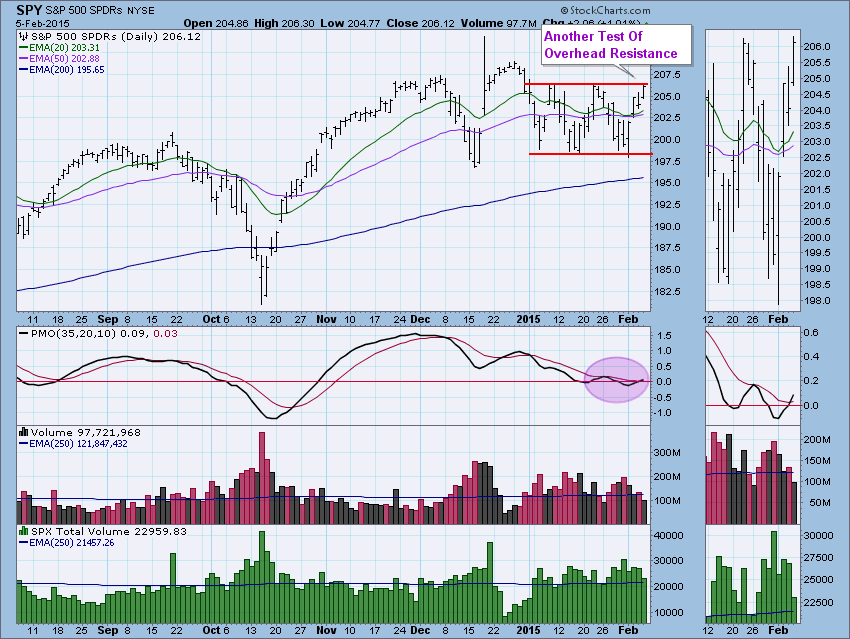
First let's look at what's hot. The SPY has moved into a medium-term consolidation, one that has confounded many of us who have spotted double-tops/double-bottoms that continually have teased us as price would hit the neckline(s) and move in the other direction, keeping price bounded. Today the SPY once again hit overhead resistance and stopped. If we want, we could say that there is a triple-bottom and if price breaks above the neckline (overhead resistance), the minimum upside target would be a 4% increase (the height of the pattern added to the neckline). That would put price around 214.35. Given the false positives we've gotten on these patterns, I must admit to being skeptical. However, today we saw a positive PMO crossover, one that was attempted at the last top and failed. While the PMO is not really overbought, I think this still lends credibility to a bullish triple-bottom formation. Admittedly, I'm not liking the decrease in volume on today's big move so that keeps me cautiously optimistic.
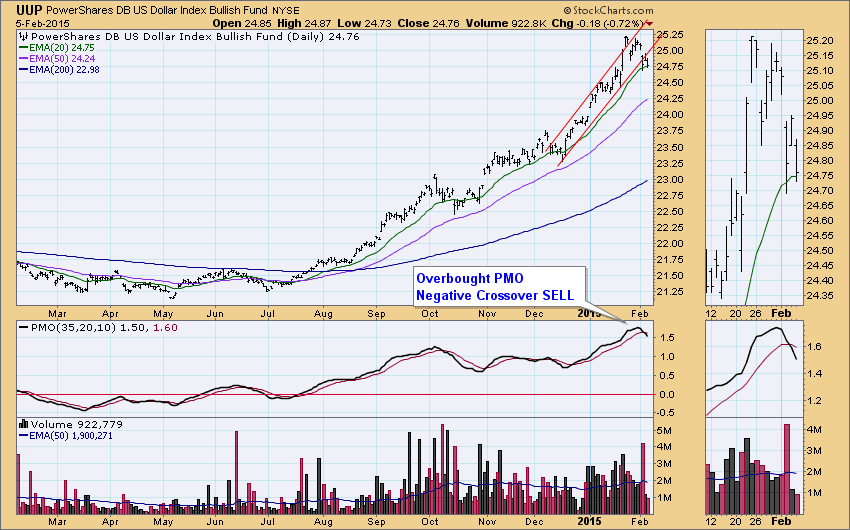
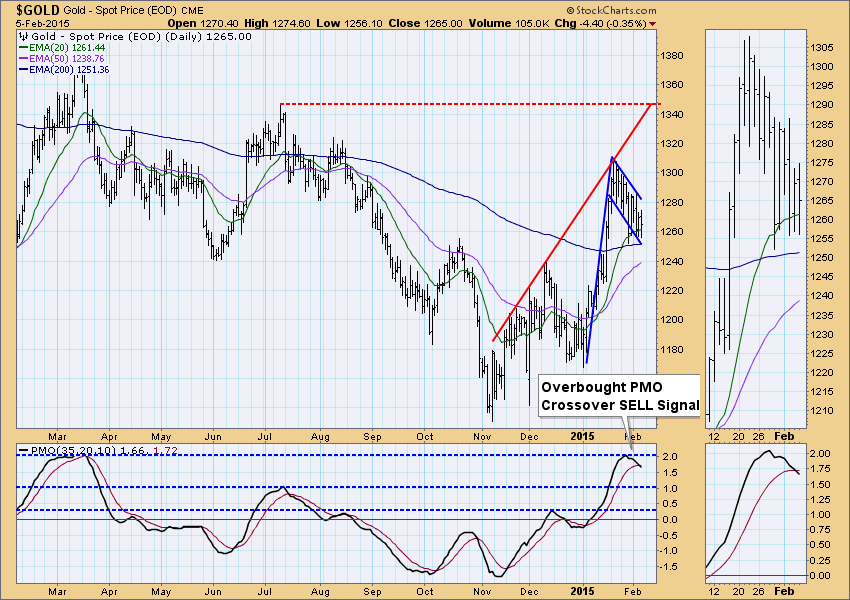
Gold and the dollar tend to move in opposite directions. A strong dollar usually means weakness in gold and vice-versa. Today, they both had PMO negative crossovers in overbought territory that generated PMO SELL signals on both...on the same day.
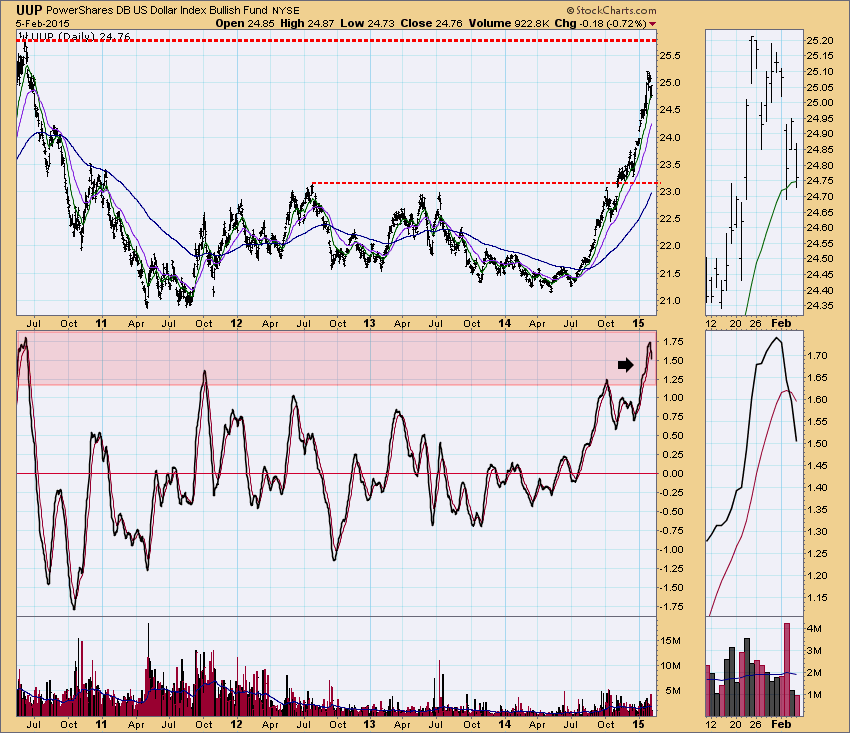
UUP, the dollar index ETF, has been climbing mostly within a rising trend. Over the last three days it has tiptoed out. It appears that new support is at the 20-EMA, but that is getting tested. The PMO SELL signal arrived during this breakdown. The PMO is extremely overbought in the near-term and the long-term (see the second chart).
We see gold is in a similar situation with an extremely overbought PMO that has crossed below its EMA generating the PMO SELL signal. I've annotated a bull flag pattern, but given momentum shifting so negatively, I would be surprised if it executes. Gold prices have managed to close above the 20-EMA, but that support is clearly deteriorating.
The Intermediate-Term Trend Model generated a BUY signal on the equal-weighted Financials ETF (RYF) when the 20-EMA crossed above the 50-EMA. There are some real positives about this chart. Granted the Trend Model BUY signal is a 'whipsaw' signal, having come out of a very recent Neutral signal, but notice that the PMO also had a positive crossover its EMA generating a PMO BUY signal as well. I also like that there is a dominant double-bottom pattern that has just executed with price penetrating the neckline. If this formation follows-through, we would have a minimum upside target around 46.
Thank you to all those who joined me for my Webinar on Wednesday. It is always a delight to "talk charts" for an hour but I especially enjoy your questions and chart requests. Be sure and sign up for my next one, the link will be on the Home Page as soon as it is ready. In the meantime, tweet me your questions or reader's request symbols (@_DecisionPoint) for me to address at the end of the webinar. This coming week I'll be demonstrating how you can use the DP Tracker reports and DP Alert Daily Report to screen for possible investments.
Happy Charting!
Erin

