We see plenty of indicators that tell us that there is a possibility for a correction, but not all indicators are sending that message. One in particular is the Advance-Decline Line (A-D Line). It is one of the first technical indicators ever developed, and it is simply a cumulative total of the daily advances minus declines. We also construct the Advance-Decline VOLUME Line in the same way, only using advancing and declining volume.
In a rising market we want the A-D Lines to confirm new price highs, and, as we can see on the chart below, that is exactly what is happening. If the recent A-D Line tops were lower than the September tops, that would be a bearish non-confirmation, but currently the A-D Lines agree with price movement. This is no guarantee that the market isn't forming an important top, but the A-D lines are saying it shouldn't be.
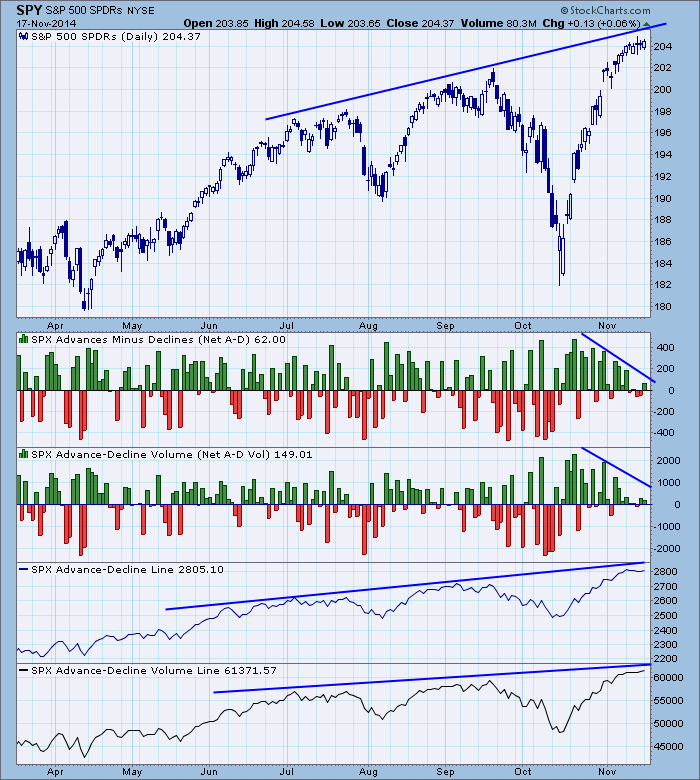
The chart also shows histograms of the daily net advances minus declines, which are very short-term in scope. As we can see, the bars have been contracting, showing fading internal support in that time frame.
Conclusion: We can see that internals are weak in the short-term, but the longer-term A-D Lines agree with price action. When there is a conflict between indicators, we normally take the side of the longer-term indicators. So, while we have a short-term indication that a pullback is likely, the longer-term indicator says that the pullback is not likely to be very serious.