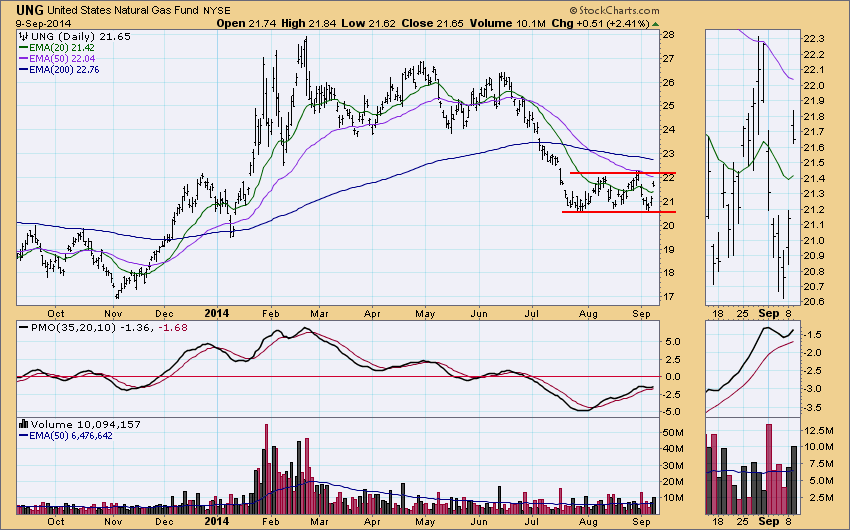
UNG, the Natural Gas ETF, caught our attention in today's ETF Tracker Report because it had the largest percentage up change at +2.41%. A quick check of the chart shows it being in a trading range for over a month, and today's move was not too impressive in that context. The short consolidation is also known as a continuation pattern, which implies that the eventual resolution will be downward as the decline from the June top continues. Additionally, the moving averages are stacked negatively with the 20EMA on the bottom and the 200EMA on the top. The PMO has been rising, but this is not positive because because it only reflects a cessation of the price decline rather than a budding advance.
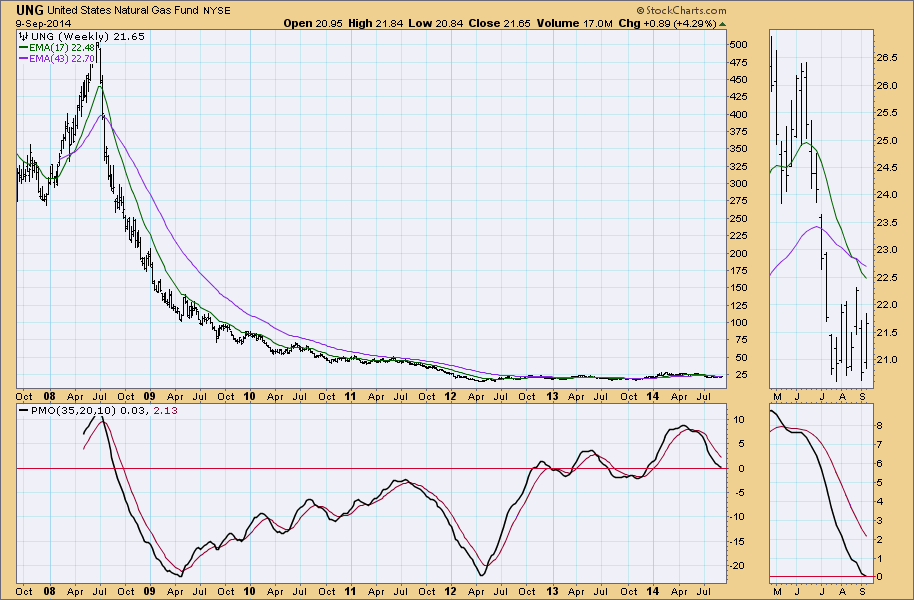
Not wanting to stop there, we zoomed out for a long-term view. Lo and behold we can see a parabolic collapse, and the initiation of a basing pattern, which is the most likely consequence of a parabolic collapse. Such a pattern can continue for years. While a breakout from the base doesn't seem likely any time soon, a trader could work the trading range until a breakout occurs--the daily chart above shows a pretty wide range.
We offer this as another example of how short-term charts need to be clarified with a longer-term context.
This view of the utter collapse of natural gas prices reminds us of analyst projections of about two decades ago that natural gas would be in permanent short supply, with prices going through the roof. To some extent this did come to pass, but then new technologies changed everything. It goes to show how hard (impossible?) it is to see into the future. This is why we say that technical analysis is a windsock, not a crystal ball. It will show us which way the wind is blowing at a given moment, but it can't tell us what the wind direction will be when we try to put the wheels on the runway.


