
I recently received an email from a DP Daily Update subscriber:
" On 9/16 [in the] DecisionPoint [blog] you wrote, "Indicators in all time frames are quite bearish." (First sentence of second to last paragraph.)
On 9/18 [in the] Decision Point Reports [blog] you wrote, "All of our indicators are now looking bullish..." (First sentence of Conclusion.)
Please reconcile. Thanks.
- Confused and Disoriented "
I review indicators in three timeframes everyday in the DP Daily Update. Generally, you only see overnight rollovers from bearish to bullish and vice versa in the ultra-short-term and short-term indicators, while intermediate-term indicators change far less frequently. So it can be confusing to read my daily commentary one day and the environment is bullish across the board and then a day or two later the environment is bearish. Let's review the indicators in each time frame. I'm going to use charts from the DecisionPoint Chart Gallery. which is free to use for the SPX. The difference between looking at the DP Chart Gallery versus the DP Daily Update is it's missing the daily analysis of each chart. That is only available to paid subscribers in the DP Daily Update, located in the DecisionPoint Reports blog.
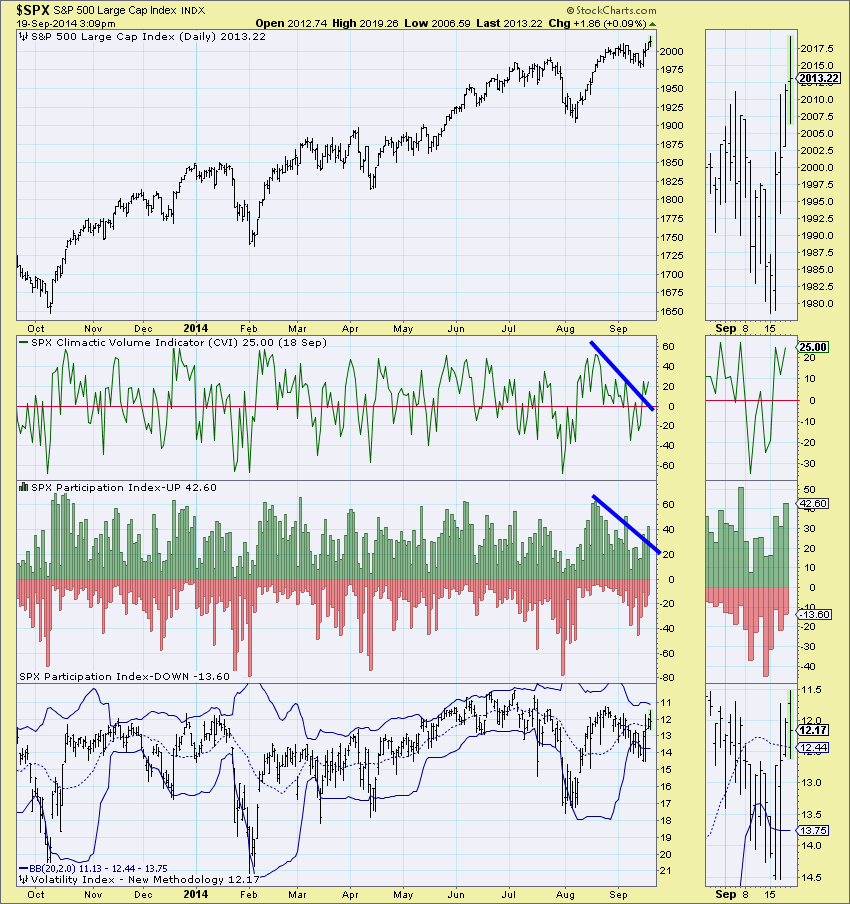
First in the ultra-short term, we review the CVI and Participation Index - UP/DOWN. Notice these indicators are quite volatile. You can see that when I wrote the DecisionPoint blog article on 9/16, "Have You Checked the DecisionPoint Chart Gallery Lately?", at the beginning of the week, the indicators were in a downward trend which is bearish, however a few days later in my 9/18 DP Daily Update, they had broken from this downward trend which is bullish.
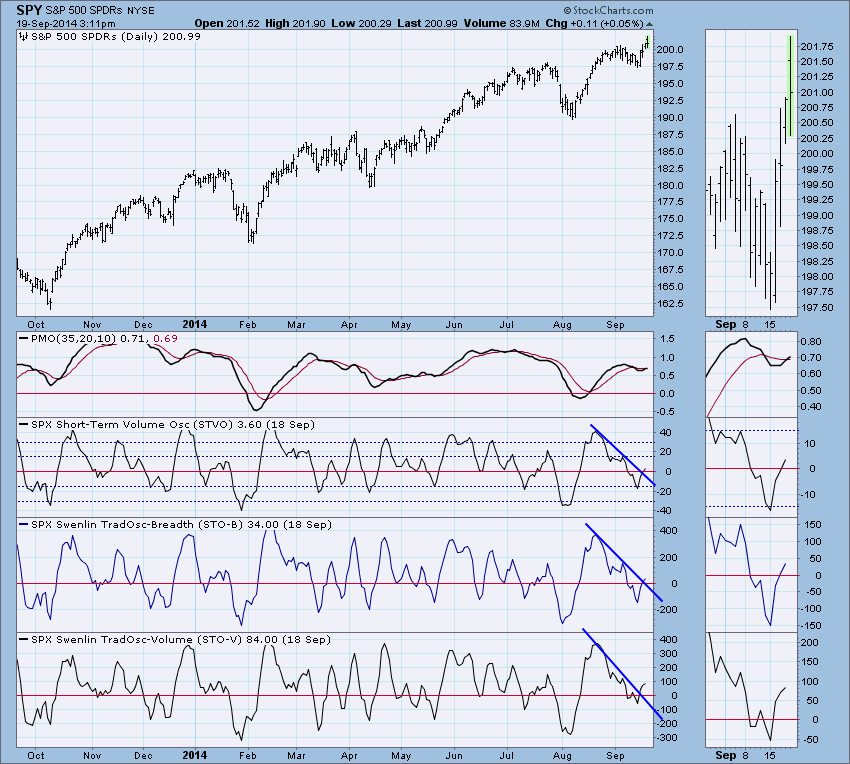
Short-Term indicators had a similar set-up. They had been in a declining which is bearish. On the 16th all short-term indicators bottomed but remained in the declining trend which is somewhat bearish. Note there are other times when these indicators bottom, but then quickly resume their decline. That's why I prefer to wait for a "breakout" from the trend before calling the indicators bullish and that is what happened on 9/18.
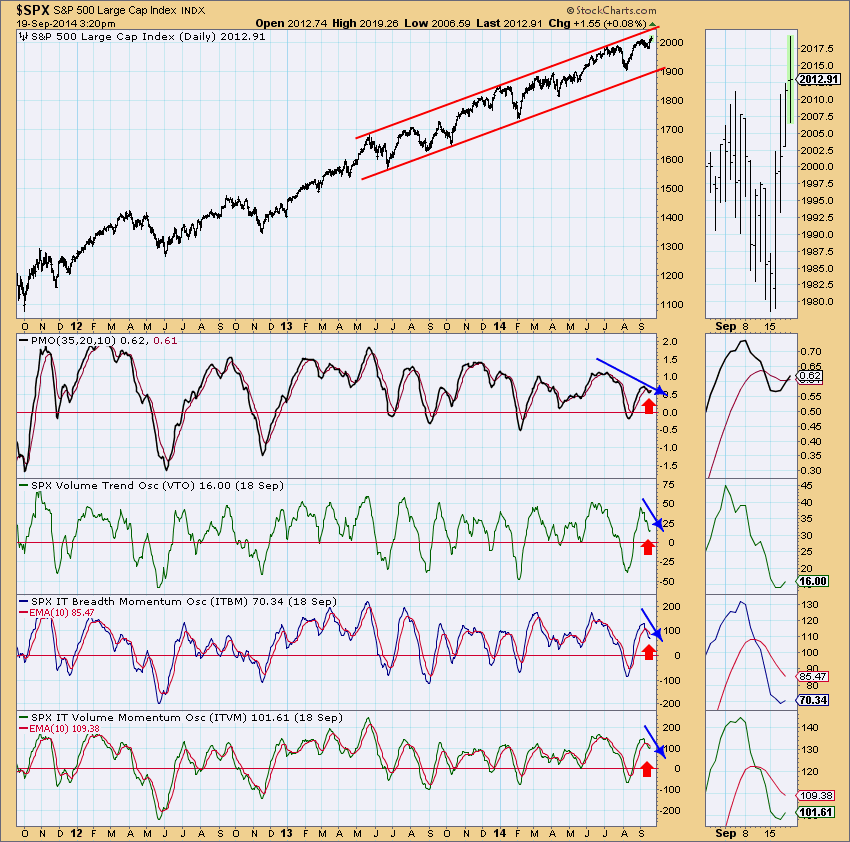
Intermediate-term indicators were in a declining trend like the other indicators. In the case of the PMO, ITBM and ITVM, we include their 10-EMA and both had recently had negative crossovers during their decline which is bearish. However, on 9/18 these indicators turned up which is intermediate-term bullish.
It is a little unusual to see all three time frames to go from bearish to bullish at the same time, but in big price trend changes, it will happen. Price went from a declining trend into a fast and steep rally which effected market indicators in all three time frames. There are nuances in the charts that are displayed and I address them in my DP Daily Update analysis. For example, although intermediate-term indicators have turned up, they turned up in somewhat overbought territory which makes the indicator bottoms less bullish.
I invite you to subscribe to the DP Reports blog, the DP Daily Update in particular, so you can start to identify these changes and what they mean. By following my commentary daily you will get the continuity necessary to learn the indicators so you can take your analysis to the next level.
Happy Charting!
Erin


