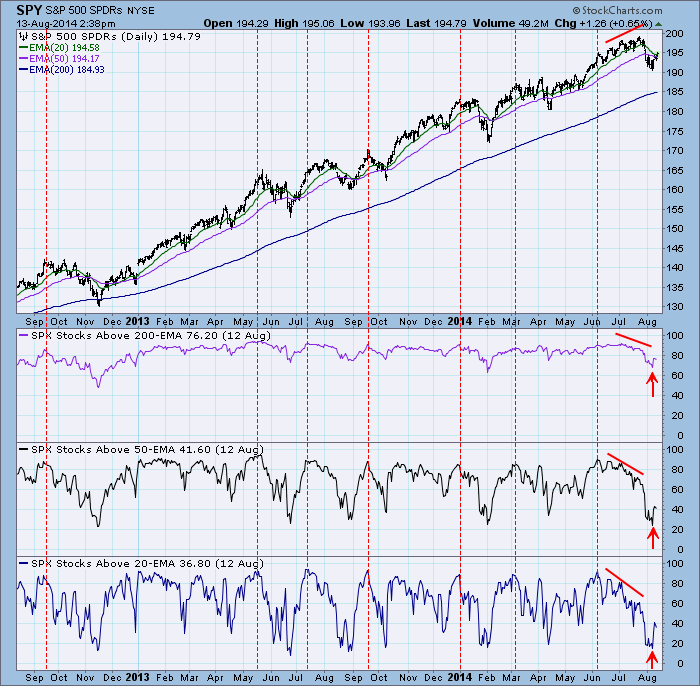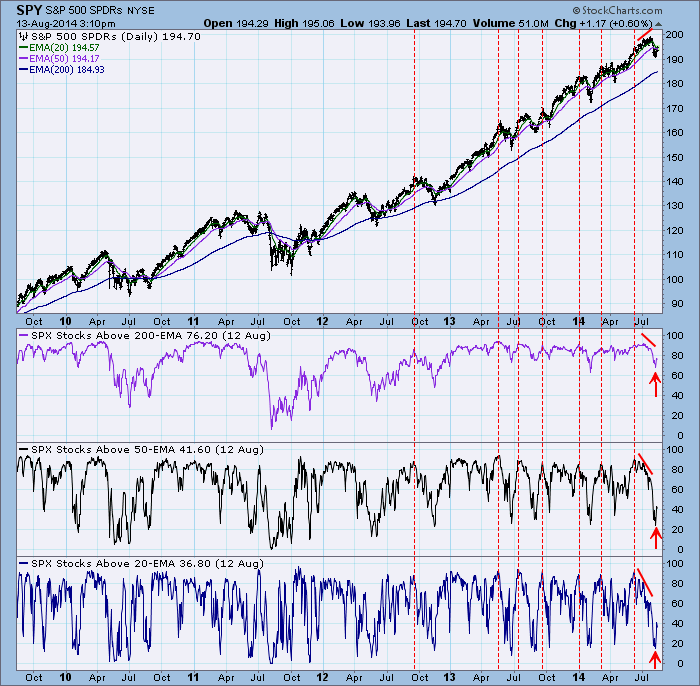
Our indicators, the Percentage of Stocks Above their 20/50/200EMAs, gives us a view of market internals in three time frames: the 20EMA is short-term, the 50EMA is medium-term, and the 200EMA is long-term. When they have all reached the same extreme on either side of their normal range, we begin to expect a price reversal. Back in June we noted that they had all reached the overbought side of their normal range, which suggested that a price top was in the making. However, we can see how in previous instances prices can drift sideways or higher before the actual price top finally arrives. In the case of the June indicator tops, the indicators drifted lower through June and July, creating a negative divergence to price, which moved higher. The price top arrived abruptly at the end of July, and soon after, the indicators bottomed at the oversold side of the range, suggesting that the price bottom might be solid.
We should point out that none of the oversold indicator readings, particularly the 200EMA percentage, are close to historical extremes, as we can see on the 5-year chart below. The lesson is that we need to put current indicator readings in the context of the more recent range. The last two years of the bull market has been so strong that some indicators simply cannot become deeply oversold before corrections are over.
Conclusion: The Percentage of Stocks Above Their 20/50/200EMAs indicators have bottomed near the level that has proven to be oversold in the recent months of the bull market. While our analysis of other technical tools in the DP Daily Update has not concluded that the correction is definitely over, these indicators certainly make a good case for that assessment.
Technical analysis is a windsock, not a crystal ball.
-Carl


