For some time, our intermediate-term indicators have been oscillating in a tight range. But since the breakout rally began, readings are now setting themselves apart. Let's look at a few charts from the DP Chart Gallery.
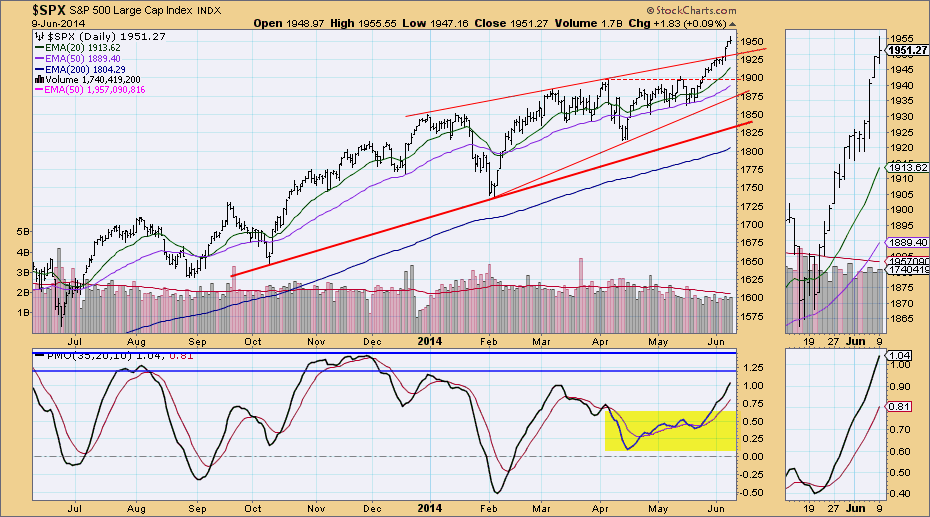
First is the daily chart for the SPX. Price broke out above a rising wedge on this recent rally. An ascending wedge is a bearish pattern, so to get a bullish breakout from a bearish set-up is positive. The PMO is confirming this breakout rally by not just rising, but clearing from the crowded readings we had over the past few months. Also good news is that even though it's overbought, the PMO has more room to rise before reaching extremely overbought territory.
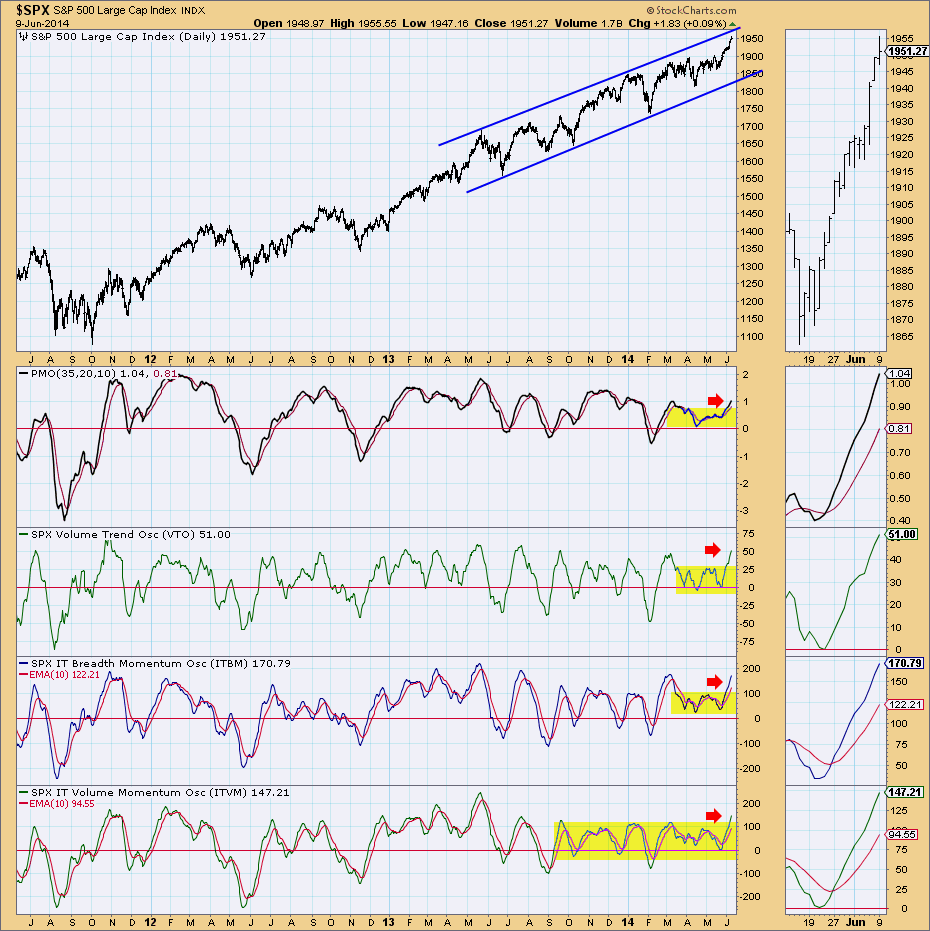
The ITBM and ITVM all have continued to rise since their positive crossovers and the VTO is rising up as well. The readings are clearing congestion, which suggests internal strength in the market right now. This chart is longer term, note that price still has room to move higher before hitting overhead resistance...granted not a whole lot of room, but room, none the less.
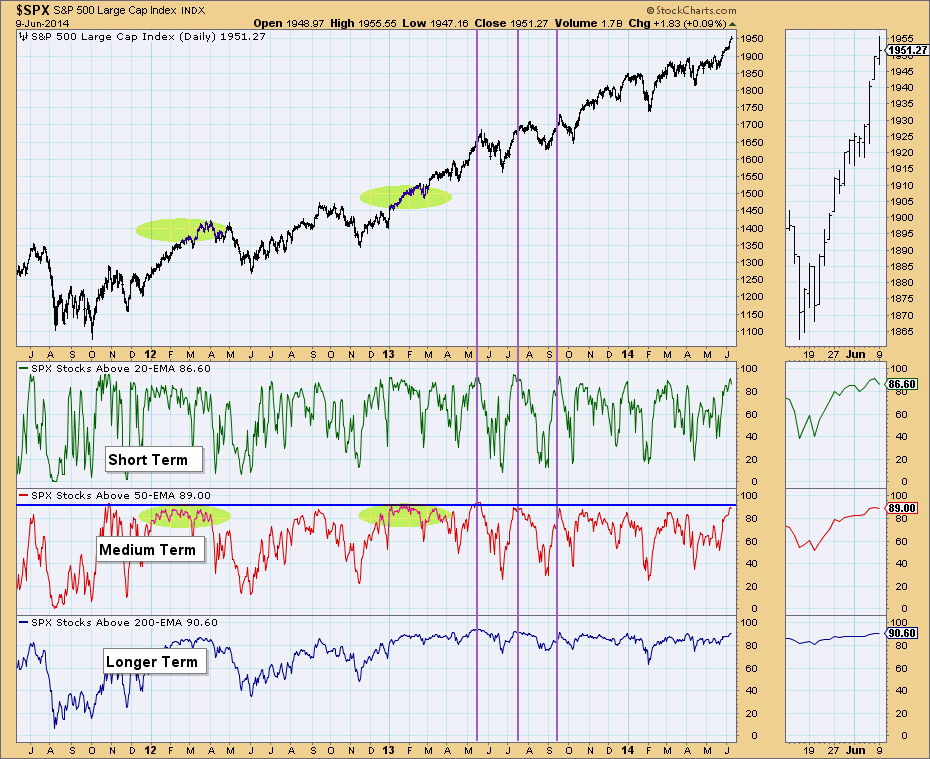
Also from the gallery, let's look at the Stocks Above Their 20/50/200-EMAs. Let's concentrate on the Stocks Above Their 50-EMA since that is the intermediate-term indicator on this chart. Right now the reading of 89.00 is overbought. Note in the green ovals, these readings can linger for some time in extremely overbought territory in a powerful bull market. However, shorter term, the vertical lines are from readings that hit the top and descended quickly after that. Those do line up with medium-term price tops and it is worth noting that the short-term Stocks Above Their 20-EMA was also at a top when those price tops occurred.
Some of the intermediate-term indicators are now in overbought territory or approaching it, but I see this as characteristic of a solid bull market.
Happy Charting,
Erin


