
JURY DUTY, BLACKJACK and CRYSTAL BALLS
(edited 4/2014)
As many of you are aware, I've been doing my duty as a citizen of this great country by serving on a jury. It has been interesting, to say the least.
After my fellow jurors found out I was a stock market analyst and blogger, I began getting questions like, "What is the market going to do?", "Can you tell me what stock I should buy?", "What is up with the Fed?", etc.
For those of you who have had the pleasure, you know that jurors have a LOT of time on their hands. It seems you ‘hurry up and wait' constantly, so I was able to answer questions (except the one on the Fed, because that story changes day to day).
I began explaining my job as best I could without getting too technical. First and foremost I told them that 1) I cannot predict anything, I have no crystal ball because if I did, I'd be rich and likely in the French Riviera, not here sitting on this jury; and 2) I am not a registered investment advisor, so don't take anything I say as a recommendation to buy or sell.
I told them that my job is to get as much information about market trends and conditions as I can so I can evaluate whether I want to take action or not. Then I blog about it. I explained that you didn't want to ‘bet' against the trend or conditions that tell you to expect a certain outcome. You have to determine what is happening in all three time frames, short-term, intermediate-term and long-term and let each time frame guide you along.
All three time frames may say something different, but ultimately, the long-term trend affects the outlook for not only the long term but also, the intermediate term; and they both affect the outlook for the short term. Additionally, I consider our DecisionPoint technical indicators. They give me insight into what the condition of the market is, whether overbought or oversold. Overbought conditions imply the market is in need of a correction or pullback and oversold conditions imply it is time for buyers to step in.
I equated it to blackjack (not that investing is the same as gambling, although for the uninformed investor I suppose it is). You will generally do better than the ‘house' or the market if you know the best way to play your hand. You evaluate the condition of the dealer's hand (is a six showing or a ten?) and the card trend (how many small or high cards have already been played). You won't always win, but you have a better chance by making an informed decision.
So, what is the trend and condition of the market right now?
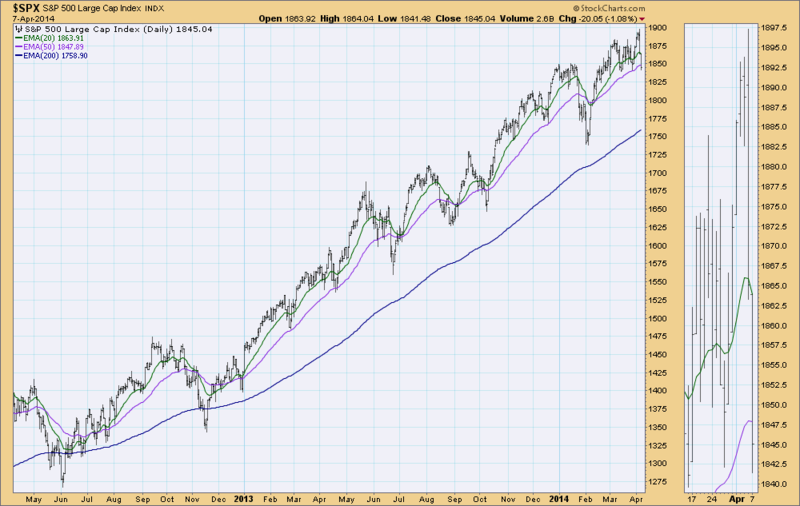
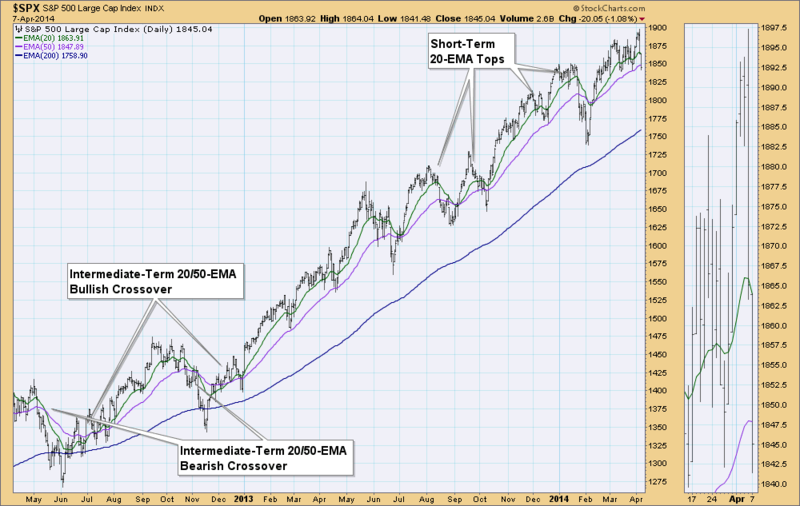
First let's evaluate the "trend". DecisionPoint analysis uses exponential moving averages (EMAs) and their position to analyze the trend in the short-, intermediate- and long-term. The chart below shows that in the long-term and intermediate-term time frames, the trend is bullish. The 50-EMA is well above the 200-EMA, so the long-term trend is still very bullish. The 20-EMA is still above the 50-EMA so the intermediate-term trend is technically bullish. However, the 20-EMA is currently falling, so the short-term trend is bearish.
You can take this trend analysis one step further. Note that 20-EMA tops have come during short-term pull-backs and when the 20-EMA has crossed below the 50-EMA, there is an alert to intermediate-term corrections. When the 20-EMA crosses back above the 50-EMA, it is an alert that the market has switched to intermediate-term bullish and the pullback/correction is likely over.
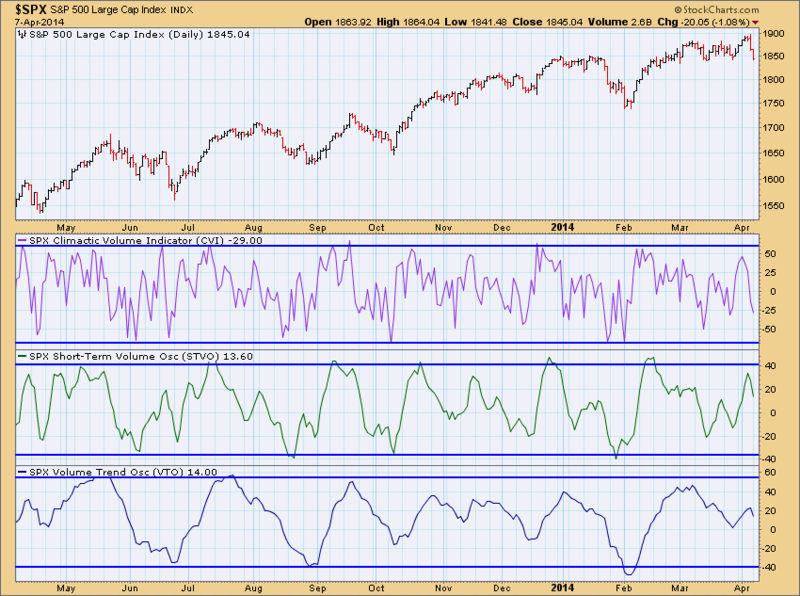
Of course in a very strong bull market like the one we are currently in, the trend stays relatively steady. So, let's evaluate the condition. There are a plethora of technical analysis tools that can be used, at DecisionPoint, we have our stand-bys, which include the PMO and the On-Balance Volume (OBV) suite of indicators - CVI, STVO and VTO. (You'll find these in the DecisionPoint Chart Gallery).
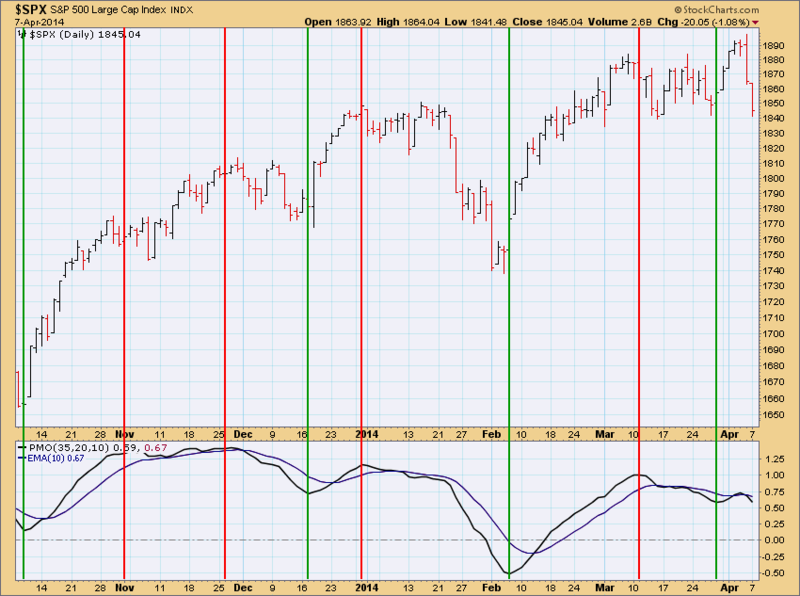
The PMO is an indicator that measures price momentum (you can read about it further in ChartSchool). When the PMO tops, momentum has switched to negative, when it bottoms, momentum is positive. Currently, the PMO is falling, suggesting negative market momentum, which is bearish.
Looking at the ultra-short-term CVI, short-term STVO and intermediate-term VTO, we evaluate market condition by determining whether they are at the top of their range (overbought) or the bottom of their range (oversold). The CVI is neutral but nearing oversold, so ultra-short term is getting somewhat bullish. The STVO has left overbought territory and is falling which is short-term neutral to bearish. The VTO is slightly overbought and falling which is suggests intermediate-term bearishness.
So, market conditions are not optimum. The market is losing momentum according to the PMO. Market conditions overall are neutral to bearish based on the OBV suite.
Back to Blackjack... How should we play this hand? It appears I have a good hand because the long-term and intermediate-term trend is with me. However, the shorter-term trend is neutral to bearish and market conditions could work against me. My hand is good, but a "10" is showing for the dealer. It is time to play conservatively. I don't think I want to ‘double-down' on my bet and 'invest more' money, I'll count on the trend and stay in the game.
Unfortunately like blackjack, there is some ‘luck' involved. In the market, I equate luck to those outside influences on the market that I don't have control over and can't usually predict. Things that can throw the market an unexpected curve ball might be, the Fed tapering talks, unemployment numbers or housing reports. Right now, news out of the Fed can cause the market to shoot up or tumble lower on just one headline! A stray economic report combined with an utterance from the Fed, and all my prudent investments can greatly suffer or profit without any basis in technical analysis.
Conclusion: I told my jury friends to keep it simple, don't get bogged down in the chatter and noise. Get educated on some simple tools of technical analysis, learn as much about current market conditions and trends as possible so your investment decisions are based on analysis, not chance. Don't let the "house" take advantage of you!
Happy Charting,
Erin


