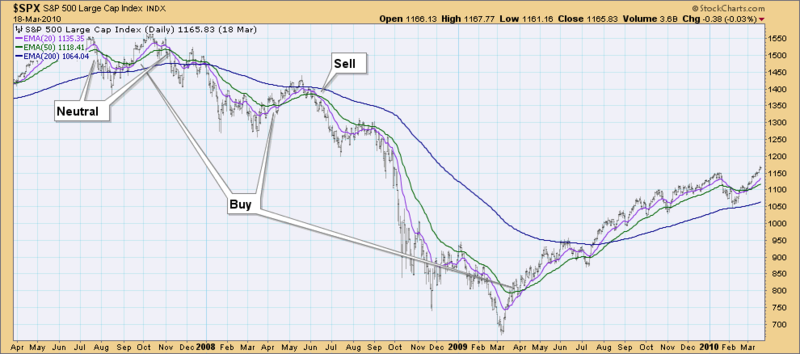

First, let's look at how Moving Average Trend Assessment can cue us on shifts from bear to bull to neutral markets.
When the 20-EMA crosses above the 50-EMA that generates a 'buy' or bull signal. Regardless of the location of the 50-EMA in relation to the 200-EMA, a positive 20/50-EMA crossover is considered bullish. A 20/50-day negative crossover is different. If the 20-EMA crosses below the 50-EMA while the 50-EMA is above the 200-EMA, that is "neutral"; if it is below the 200-EMA, that is a "sell" signal.
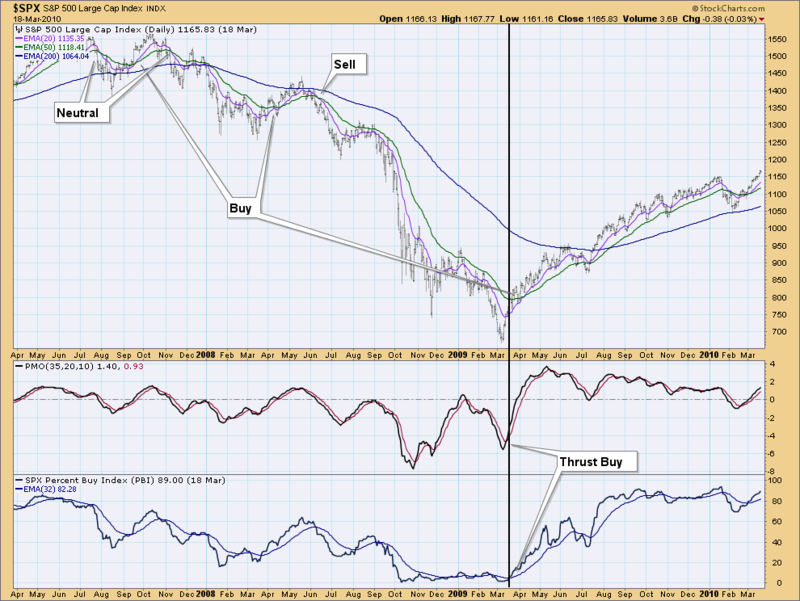
Now let's look at the same time frame, but add the Thrust component. The thrust component is made up of two indicators, the PMO (Price Momentum Oscillator) and the PBI (Percent Buy Index). When both indicators are above their EMAs, thrust is bullish. If one or both are below their EMAs, thrust is bearish.
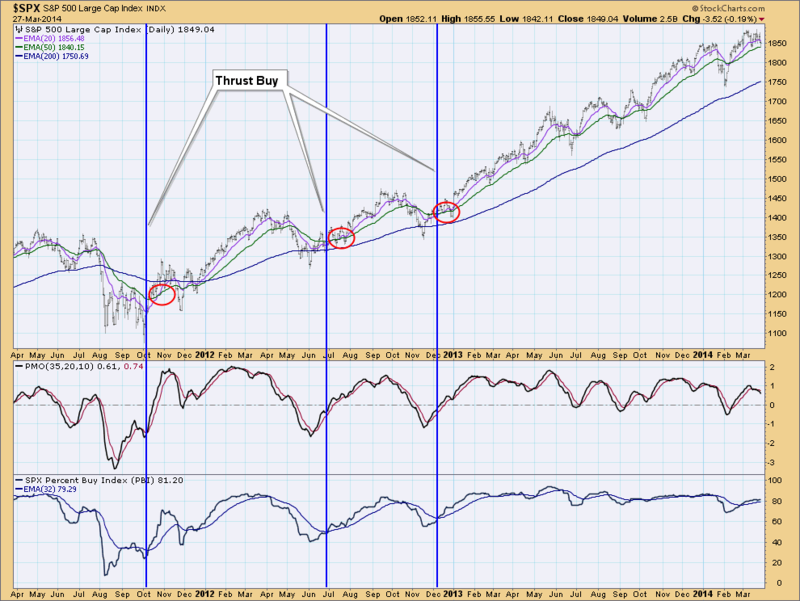
How do you use Thrust? I find it is most useful when it moves to bullish or a "buy". The idea is that we identify positive thrust early in an up move. Note in the chart above, thrust moved to a "buy" BEFORE the 20-EMA crossed above the 50-EMA. That would have gotten us positioned back in the market to take advantage of the move earlier rather than wait for the positive crossover of the 20/50-EMA. Another example is below.
One might ask, why not just use the PMO positive crossovers. The problem is that the PMO is rather volatile and will generate too many signals. You can see in the chart above how many times the PMO moves above and below its EMA.
You can find these Thrust charts in the DecisionPoint Market Indicator ChartPack in the "DPMI - 1100 Percent Buy Index (PBI)" Chartlist.
Happy Charting,
Erin


