The DecisionPoint.com merge with StockCharts.com brought a new indicator, the Price Momentum Oscillator (PMO). The PMO is highly versatile and quite good at identifying momentum shifts early. To read more about the PMO, click here for the ChartSchool article.
One of the ways I like to use the PMO is to find stocks that are just starting to gather positive momentum but have not actually had a positive crossover the signal line (10-EMA). It is a great way to build a personal "watch list".
And now the StockCharts Scan Engine makes finding such stocks really easy. This is a HUGE improvement over the old DecisionPoint.com website! To learn the basics of creating and running a scan, click here and watch the video tutorial.
Even as a beginner, I was able to create a scan that identifies stocks that have PMOs that have been rising three days but have not had a positive crossover yet. Additionally I want the 50-EMA to be above the 200-EMA. Using DecisionPoint trend assessment, I know that a stock is in a long-term bull market if the 50-EMA is above the 200-EMA. The scan I used is below:
[type = stock] AND [Daily SMA(20,Daily Volume) > 50000]
AND[today's PMO Line(35,20,10)<today's PMO Signal(35,20,10)]
AND [today's PMO Line(35,20,10) > yesterday's PMO Line(35,20,10)]
AND [yesterday's PMO Line(35,20,10) > 2 days ago PMO Line(35,20,10)]
AND [2 days ago PMO Line(35,20,10) > 3 days ago PMO Line(35,20,10)]
AND [today's ema(50,close) > today's ema(200,close)]
When I ran it there were 50 results. I weeded through them using the "10-per page" chartlist view and found four charts that looked interesting enough to add to a "watch list". Yes, that was a lot of frogs to kiss!
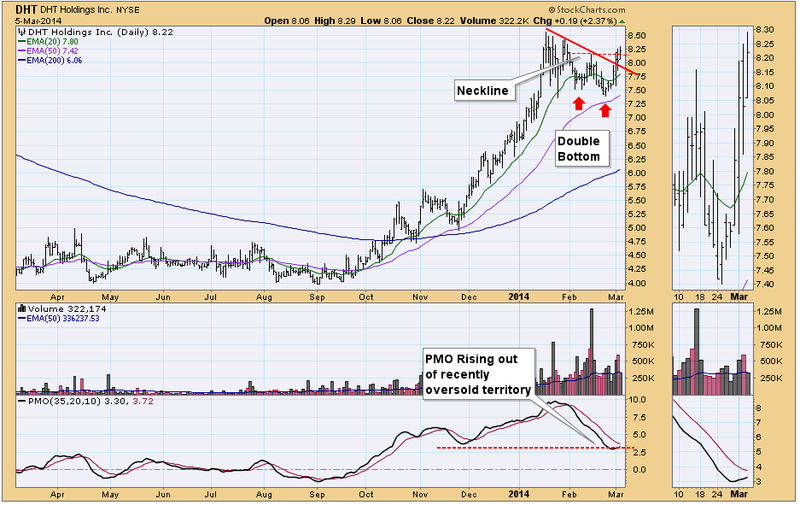
First is DHT Holdings Inc (DHT). Here's why I added it. The PMO is bottoming slowly and deliberately, meaning there isn't any wiggle or noise. While the PMO isn't in long-term oversold territory, it is around the area it last bottomed. Note that the positive PMO crossover at that last bottom was quite profitable. Obviously, this isn't a guarantee it will repeat, but it is noted. Price has not only broken through the neckline of a short-term double-bottom, it has also broken above short-term resistance. The EMA configuration indicates the stock is still in a bull market (20-EMA>50-EMA>200-EMA), so we are going with the trend, not against it.
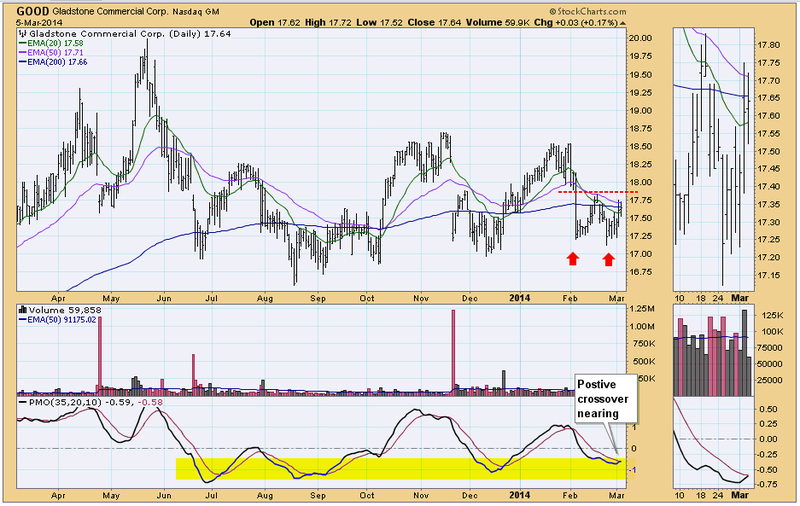
The second chart that interested me was Gladstone Commercial Corp (GOOD). It has a similar double-bottom pattern but price hasn't quite penetrated the neckline yet. The PMO is moving cleanly without any whipsaw. It also may have a PMO positive crossover in oversold territory. I do not like the that the 20-EMA crossed below the 50-EMA and 200-EMA. The trend isn't on our side, but because of the other positives, it's still worth watching.
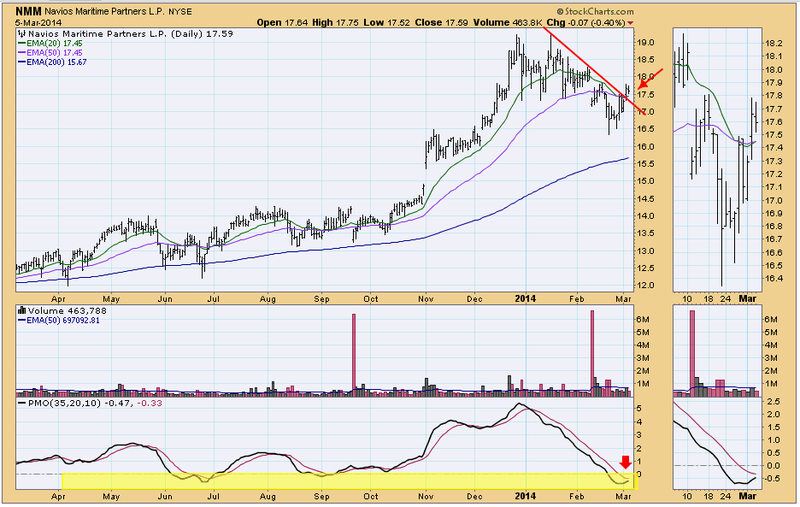
Third chart is Navios Maritime Partners (NMM). Price has broken out above the declining tops line resistance and the 20-EMA is crossing back through the 50-EMA. The PMO is bottoming in oversold territory. I'd like to see price breakaway further from the resistance line and see the 20-EMA put some distance between it and the 50-EMA.
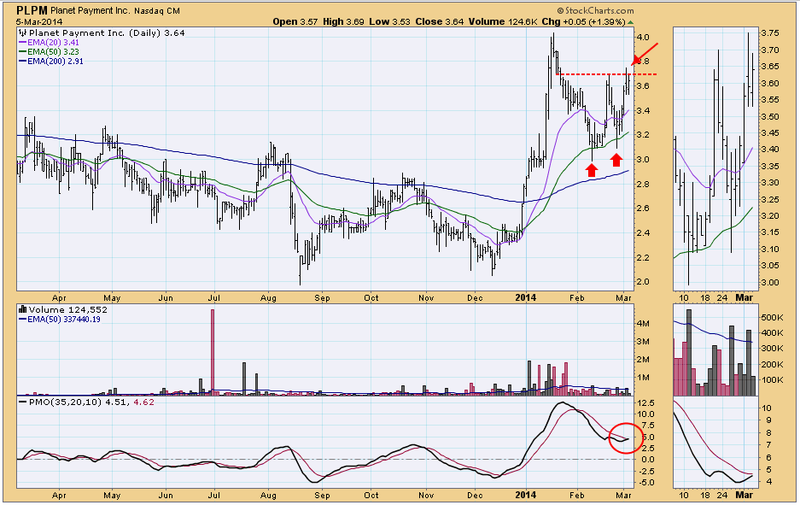
Last chart is Planet Payment Inc. Price has penetrated a double-bottom neckline, but it dropped back today. It is still a bullish formation and has time. The PMO is bottoming cleanly, but it isn't in oversold territory. The EMA configuration is positive long and intermediate term. Worth a watch to see what it does with the double-bottom.
Many times you'll find that while the PMO has shifted momentum, it doesn't take too much for it to shift back down, especially if the trend is against it. Each of these charts had some detractors that I would want to see fixed. Hence, the reason these charts are on a "watch list" and not in the "My Portfolio" chartlist.
In conclusion, the PMO is very useful not just in looking at positive and negative crossovers, but also looking for momentum shifts. This particular scan is a favorite of mine. I hope this exercise emboldens you to try some of your own scans using the PMO and other indicators to identify momentum shifts.
Happy Charting!
Erin


