Good news DecisionPoint.com transplants and StockCharts technical analysts - the DecisionPoint Market Indicator ChartPack has been released! This ChartPack includes the market indicators that made Carl Swenlin and DecisionPoint famous. If you are a DecisionPoint users, you really should install this ChartPack! Instructions for doing that are below.
The ChartPack contains over 350 charts organized into 26 different ChartLists. Each list enables you to choose one indicator and examine it across market indexes and sectors. For example, choose the McClellan Oscillator indicator list and you will see McClellan Oscillator charts for the SPX, NDX, DJIA, etc., as well as sectors. You can now analyze similarities and differences between indices by indicator.
My blog article yesterday used this technique. I reviewed the ITBM/ITVM across the SPX, NDX, OEX and DJIA and found some very interesting results. Check it out to see my observations.
How do you download this ChartPack into your member account?
First you need to log into your StockCharts account (very important!) and then go to the "Your Account" page. You can reach this by clicking on "Your Account" in the upper right-hand corner or by clicking on the "Members" tab and using the link in the yellow account box on the right.
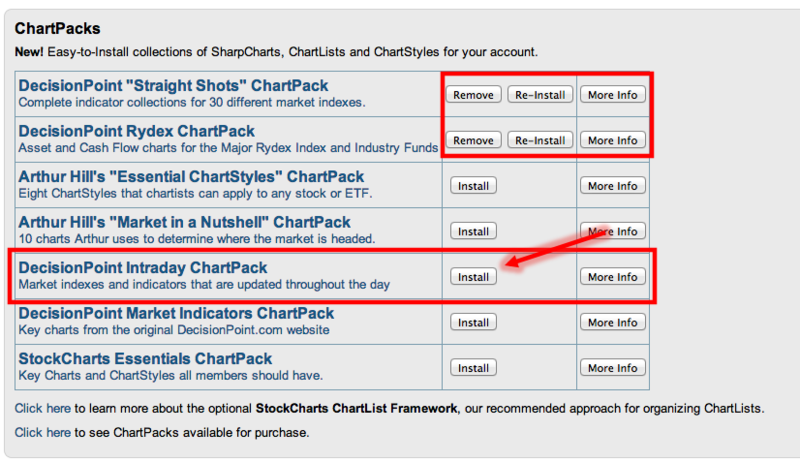
Once on the "Your Account" page, scroll down to the bottom and you will see a list "ChartPacks" that you can install. Four of these ChartPacks are from DecisionPoint and eventually you will probably want to install them all. For instance, in the screenshot below, you can see I've installed the other three DecisionPoint ChartPacks already and there are buttons that tell me I can remove or re-install them. Note however that the all-important "DecisionPoint Market Indicators ChartPack" has yet to be installed.
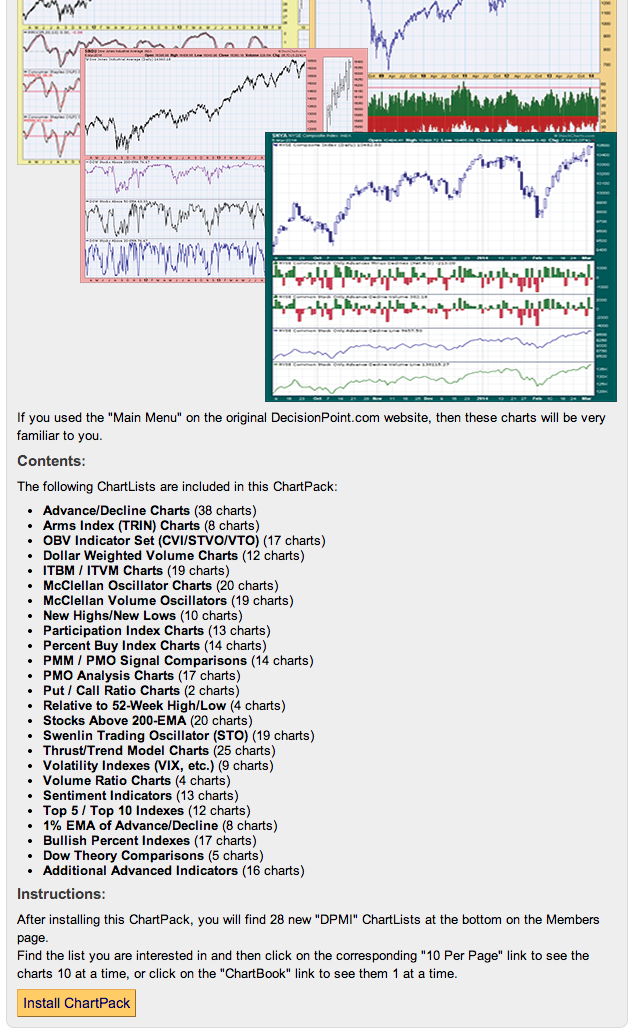
We want to install the DecisionPoint Market Indicators ChartPack. So, click on the "Install" button that corresponds to that entry. You'll be directed to a page that will give you a brief overview of the ChartPack contents and a yellow "Install ChartPack" button at the bottom. Here's what it looks like:
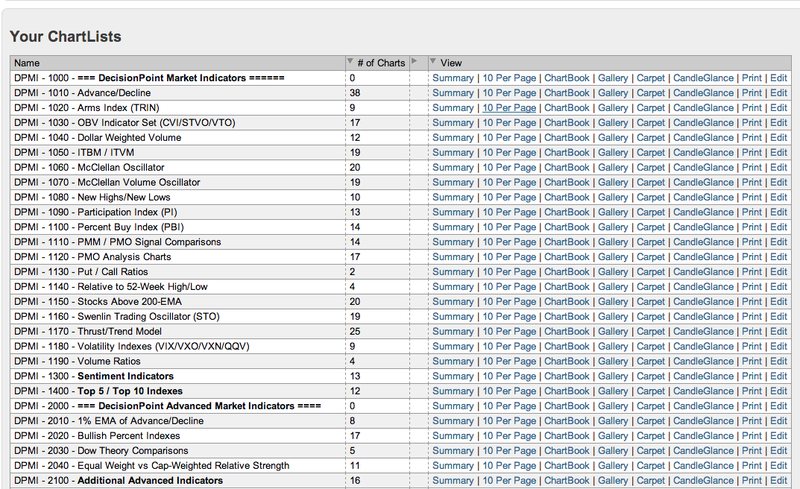
After reviewing that information, click on the yellow button and Voila! The ChartPack is now a part of your ChartLists in your account. Scroll down to the bottom of the "Members" page to see your new ChartLists:
Pick an indicator, you would like to explore across indexes and sectors. You can view its charts in either 10 Per Page or in ChartBook format (i.e., 1 per page).
Take time to review the many indicators available. If you are unfamiliar with one, you can find out more about it by typing it in the "Search" box on the right side of the Members page. It is eye-opening to see one indicator and glance at its configuration across the different markets. Download it now and try it out. If for some reason you aren't happy with it, you can click the "Remove" button from the "Your Account" page and it will disappear from your lists.
Happy Charting,
Erin & Chip


