OK DecisionPoint users, are you ready for the power that is SharpCharts? I think you are! In the past, I was often asked by DecisionPoint subscribers, "Can I save my charts to a list?" and "How do I annotate my charts?", etc. I used to have to tell them, "Sorry, you can't." Well, no longer is that the case! SharpCharts offers these features and much, much more.
Let's compare the old DecisionPoint.com ChartTool to the SharpCharts Workbench.
ChartLists
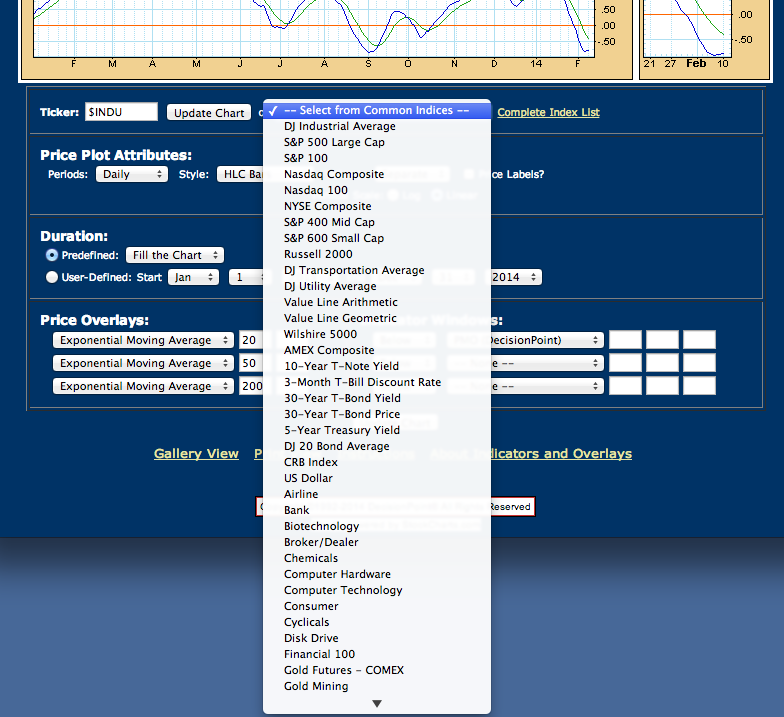
The old ChartTool on DecisionPoint.com allows you to pick a ticker symbol to chart or pick from a pre-made list of major indices.
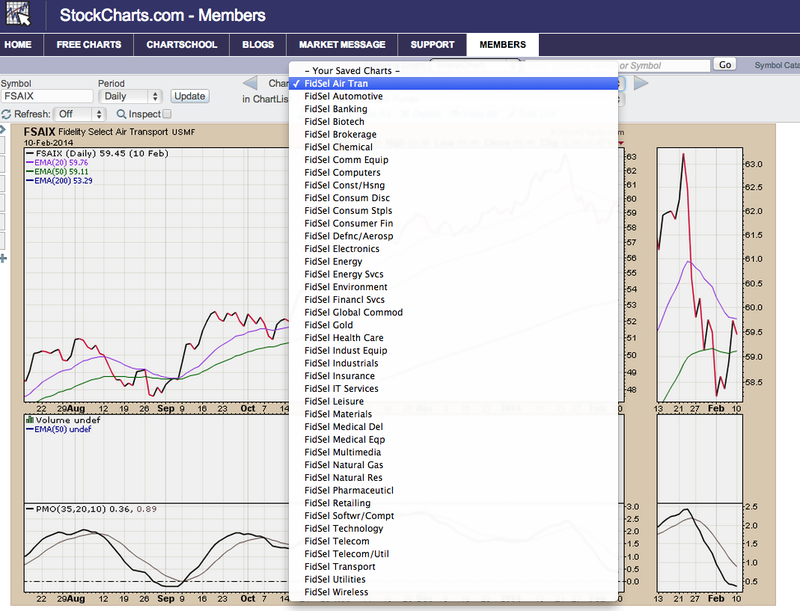
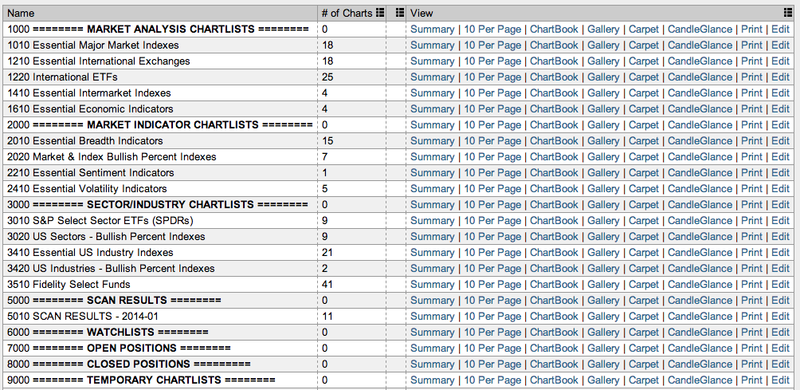
While this is handy, SharpCharts allows you to put together groupings of your own or use ready-made ChartPacks. Maybe you want a list for your portfolio, or a 'watch list', or a grouping of mutual funds YOU follow. It is easy to access that list and the charts within it. Very soon, DecisionPoint ChartPacks will be available so you can select your favorite indicator charts too.
Because you have the ability to save charts and use lists, it allows for different viewing options, not just one chart on one page. Note all of the viewing variations below.
Chart Attributes
The old ChartTool's attributes section is very limited. You can pick periods, "daily, weekly, monthly". Select the style, OHLC, HLC, Line or candlestick. You can include volume below or as an overlay. Log or linear scale is available and price labels for major tops and bottoms. All charts automatically appear with a zoom thumbnail in one color scheme.
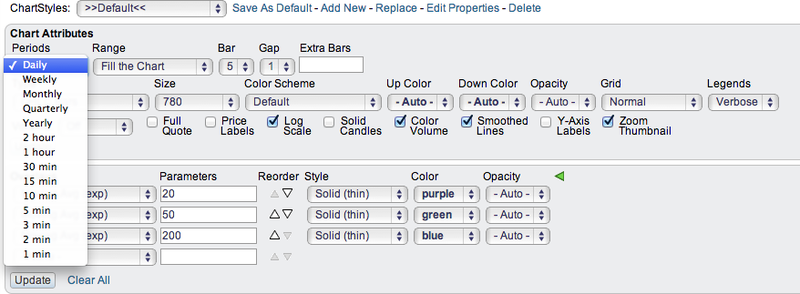
The SharpCharts chart attributes section has countless options to make your chart your own. First, the time periods can be adjusted (with membership) from 1 - 3 minutes, 5 mins, hourly, and more!
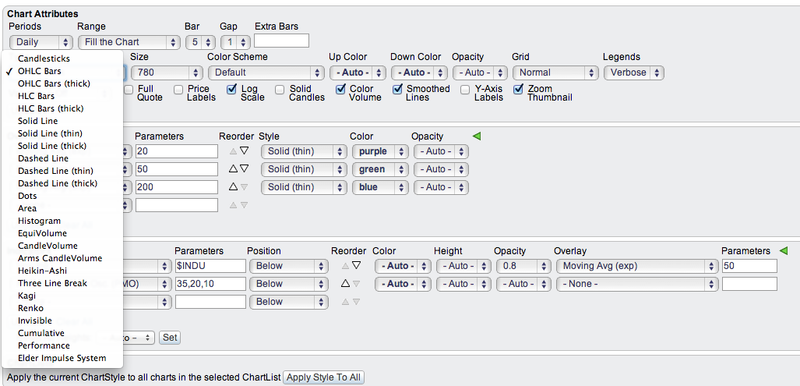
I love that I can adjust the size of the chart to make it bigger or smaller, use different color schemes, choose from 23 different styles including those already in the ChartTool. I can even pick the colors I want to represent lines, volume, histograms, etc.
Looking at the picture above you can also see attributes like smoothed lines and legends from minimal to verbose. Add and subtract features and styles, experiment, have fun!
Overlays and Indicator Panes
The old ChartTool only allows for three separate indicator panes to be added to your chart from a list of 24 indicator types. Depending on your Stockcharts.com member level, SharpCharts gives you the power to add 25 panes from a collection of 45 indicator types! The ChartTool offers a maximum of 3 overlays of 8 different types, but the Stockcharts.com members can add 25 overlays from a collection of 19 different types with numerous color and display options. You can even place overlays on your indicator panes!
Additional SharpCharts Features
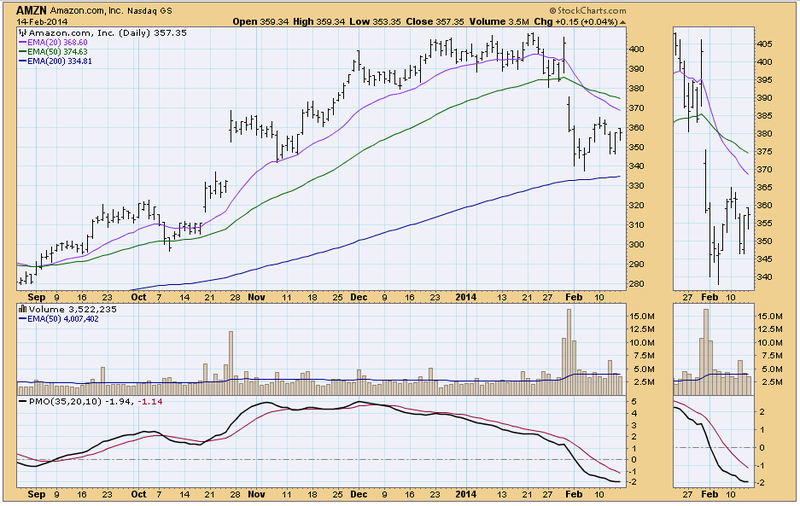
One of the biggest differences between the DP ChartTool and SharpCharts is the ability to annotate your charts and save the settings as a "Chart Style". You can adjust the charts to just the way you like them and save it as your default style. My default style is the look of the DecisionPoint.com charts. The same colors, the volume and PMO included as indicators and 20/50/200-EMA overlays.
(Click here for a live version of this chart)
There are far more SharpCharts features than I could possibly write about in one blog. I highly recommend you check out the "Getting Started with StockCharts" videos to become familiar with the limitless ways you can create your charts. For a "hands-on" approach, the Stockcharts University courses are invaluable if you can get to one in your area.
Finally, I want to remind DecisionPoint users that DP ChartPacks are not available quite yet but they will be released soon. They will include ChartLists with 'ready-to-use' indicator charts and groups that look like the charts you are used to. For Stockcharts users that want to "up their game", these new ChartPacks will give you strategic views of indices with targeted indicator charts to provide a quick yet thorough review of trends and conditions.
Happy Charting!
Erin
P.S. Breaking News! The DecisionPoint Market Analysis Chart Gallery is now live on StockCharts! Click here to see all your favorite DP charts on one page. More on that in my next post.

