 In the first few minutes of the trading day, a great deal of overnight emotion is captured. Sometimes special events cause chaos. For example, on the New York Stock Exchange it may take several minutes for the market maker (used to be a specialist) to open a stock for trading because of a large order imbalance. However once a stock or commodity does open, a point of reference has been established. From this reference point, trading decisions are made throughout the day. The Japanese believed that the period of time from the close of trading in the previous session to the current session’s open is very important. Many things can happen during that time to affect a trader’s decisions.
As the trading day progresses, extremes are reached as speculator emotion is tossed around. These extremes of emotion are recorded as the high and low of the trading day. Finally, the trading day ends and the last trade is recorded as the closing price. This is the price that many will use to help make decisions about their positions and the tactics they will use at the open of the next trading day.
So how through the daily ebb and flow of human emotion does one determine the existence of a candlestick pattern? Most candlestick patterns require the identification of not only the data relationship making the pattern, but also the trend immediately preceding the pattern. The trend is what sets up the psychology of traders for the candle pattern to develop.
It must be stated here that Japanese candlestick analysis is short term analysis (one to seven days in my opinion). Any patterns that give longer term results are surely coincidental. That does not mean that longer term price movements cannot begin from candlestick patterns, but the patterns themselves should only be used as short term trade triggers.
Think of human psychology as the wild card that can trump even the soundest of trading preparation and analysis. When trading, the risk of human psychology is addressed through the use of stop loss orders (a future article).
What is a trend? Technical analysis books deal with the subject of trend quite thoroughly and define it in a number of ways. One of the most common approaches is to use a moving average, which smooths the data being presented. A moving average is exactly the same as a regular average (mean) except that it “moves” because it is continuously updated as new data becomes available. When a moving average is rising, the trend is up (uptrend). Conversely, when a moving average is falling, the trend is down (downtrend). A close below a moving average in an uptrend or above a moving average in a downtrend may be a clue that the trend may be ready to change, but the main determinant of trend is the direction of the moving average itself. A moving average is typically computed using the closing prices of whatever time period being used. There are also many different types of moving averages used in market analysis but the two most common are simple and exponential. Hey, I know what some of you are thinking. We are StockCharts.com members and already know all this stuff. I apologize, but a refresher hurts no one.
The simple or arithmetic moving average is the easiest to compute. To compute a simple 10 day moving average, add up all of the closing prices over the last 10 days and divide by 10. A simple moving average gives equal weight to each of the closing prices, which means that the closing price ten days ago means just as much in the calculation as today’s closing price.
A somewhat more advanced smoothing technique is the exponential moving average. In principle, it accomplishes the same thing as the simple average. Exponential smoothing was developed to assist in radar tracking and flight path projection. A quicker projection of trend was needed with more influence from the recent data. The formula for exponential smoothing appears complex, but is only another way of weighting the data components so that the most recent data receives the greatest weight. Even though only two data points are required to get an exponentially smoothed value, the more data used the better. All of the data is used and is a part of the new results.
An exponential average utilizes a smoothing constant that approximates the number of days for a simple moving average. This constant is multiplied by the difference between today’s closing price and the previous day’s moving average value (these are the two data points needed). This new value is then added to the previous day’s moving average value. The smoothing constant is equivalent to (2/(n+1)) where n is the number of days used for a simple moving average.
 Chart A
After conducting numerous tests on vast amounts of data, a short term exponential smoothing of the data was determined to best identify the short term trend. It gives the best, easiest, and quickest determination of the short term trend and is certainly a concept that one can understand. Simple concepts are usually more reliable and certainly more credible. The exponential period of 10 days seemed to work as well as any, especially when you recall that candlesticks have a short term orientation. Simply the data is in an uptrend if the first day of a candle pattern is above the 10-day exponential average. When you write code for things like this you actually have to say what part of the candlestick is above the average; I used the midpoint. Below is why I use exponential averages more often than arithmetic.
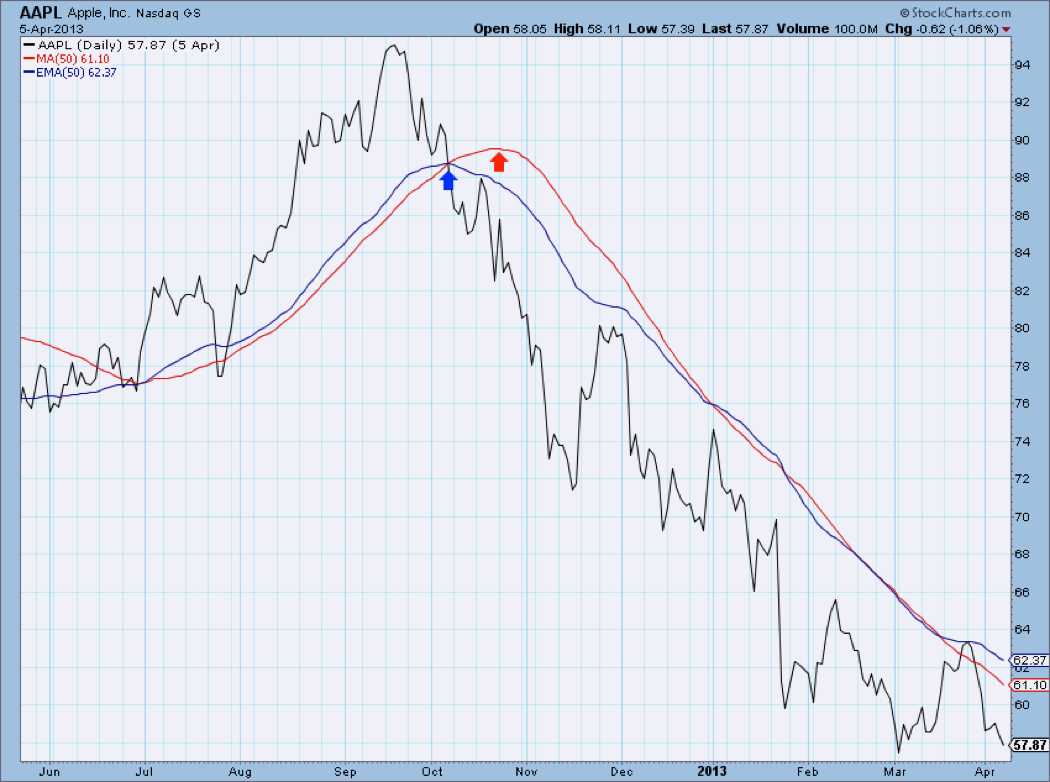
Look at Chart A, which shows a price chart and a 50 day simple (arithmetic) moving average (red) and a 50 day exponential moving average (blue). No surprises here! We all know the exponential average will hug the data closer and reverse sooner than the simple average. Now here is the information I want to share. Because of the math of calculating the exponential average it will ALWAYS reverse direction immediately after crossing the price data (blue arrow). Always – every time, no exceptions! Of course the simple average will most times continue and eventually roll over in the direction of price at a later date. This is all dependent upon the magnitude of the movement of the price data and the number of periods used in the average. In the example in Chart A, the simple average did not reverse its upward movement until almost 2 weeks later at the red arrow.
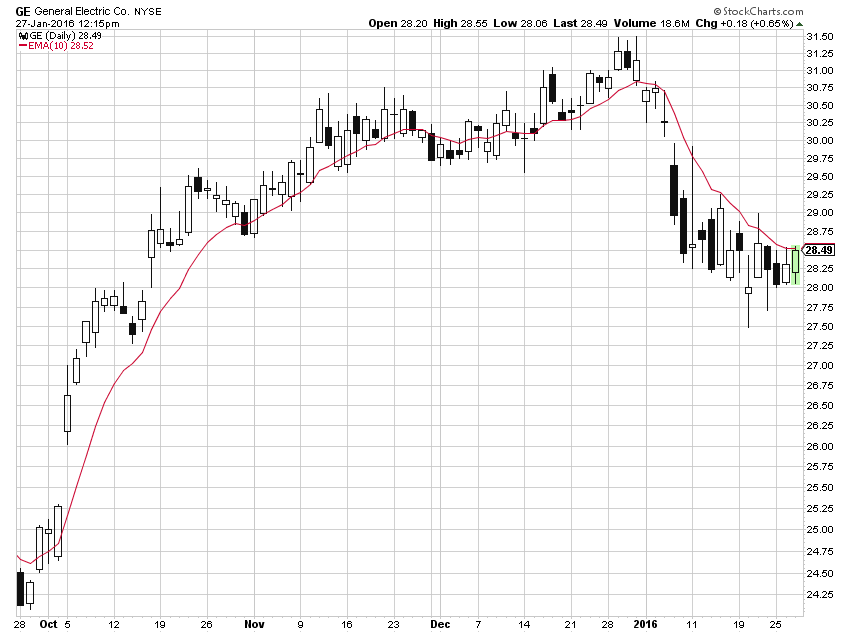
Chart B shows a stock plotted as candlesticks and a 10 period exponential average. Much consideration must be made on the length of the average because candle patterns are short term so the average (trend determination) must be reasonably tight. There will ALWAYS be periods where whipsaws in signals occur, hopefully there won’t be any candle patterns at those points. This is when you need additional tools.
 Chart B
There can a hundreds of techniques to determine the short term trend of the market – the 10-day exponential average is just one of them. I mention this because that is what I used 25+ years ago to do all the testing. Future articles on Candlestick Analysis will show a number of data tables with lots of performance statistics. I’d have to say that using some type of adaptive smoothing would be better now.
Dance with the Trend,
Greg Morris
