TAKEAWAYS
- The S&P notched new record highs in five consecutive trading sessions but snapped the winning streak on Friday
- Investors still are complacent, as indicated by the CBOE Volatility index
- The benchmark 10-year Treasury yield remains within a 4% to 4.2% range

In the first week of 2024, investors seemed uncertain that the stock market would continue the tail end of 2023 rally. But here we are, three weeks later, and the S&P 500 Index ($SPX) notches new record highs five trading sessions in a row. The last time this happened? November 2021.
It would have been nice to see the S&P 500 hit a record close to finish the trading week. It came so close.
Investors don't seem to be worried about anything right now. The CBOE Volatility Index ($VIX) remains relatively low at 13.29. This week, we received insight into some key economic data, which indicated, overall, that the US economy is slowing. This was good news for the stock market, which keeps going and going.
The Fed's most trusted inflation data point, the Personal-Consumption Expenditures (PCE) increased by 2.9%, below the 3.0% estimate. But consumer spending went up 0.7% in December, higher than expected. Consumers continued to shop, even though personal income was flat. Where's the money coming from?
Earlier in the week, the Q4 GDP was released, indicating the US economy grew at a 3.3% annual rate in the fourth quarter. It's higher than economists estimated, but it's also slower than Q3's growth, which was 4.9%.
So, overall, the data leading up to this week suggests that inflation has softened while the US economy is still strong. However, the growth is decelerating. Does that mean the US will see a soft landing? It's probably too early to tell, but it's something to listen for when Chairman Powell takes the podium next week after the Federal Reserve decision on interest rates.
The Fed is expected to hold interest rates steady in their next meeting, but investors will be listening for any clues hinting when rate cuts will start. According to the CME FedWatch Tool, there's about a 50% probability of the Fed cutting rates by 25 basis points in their March meeting.
Equities Still Rising
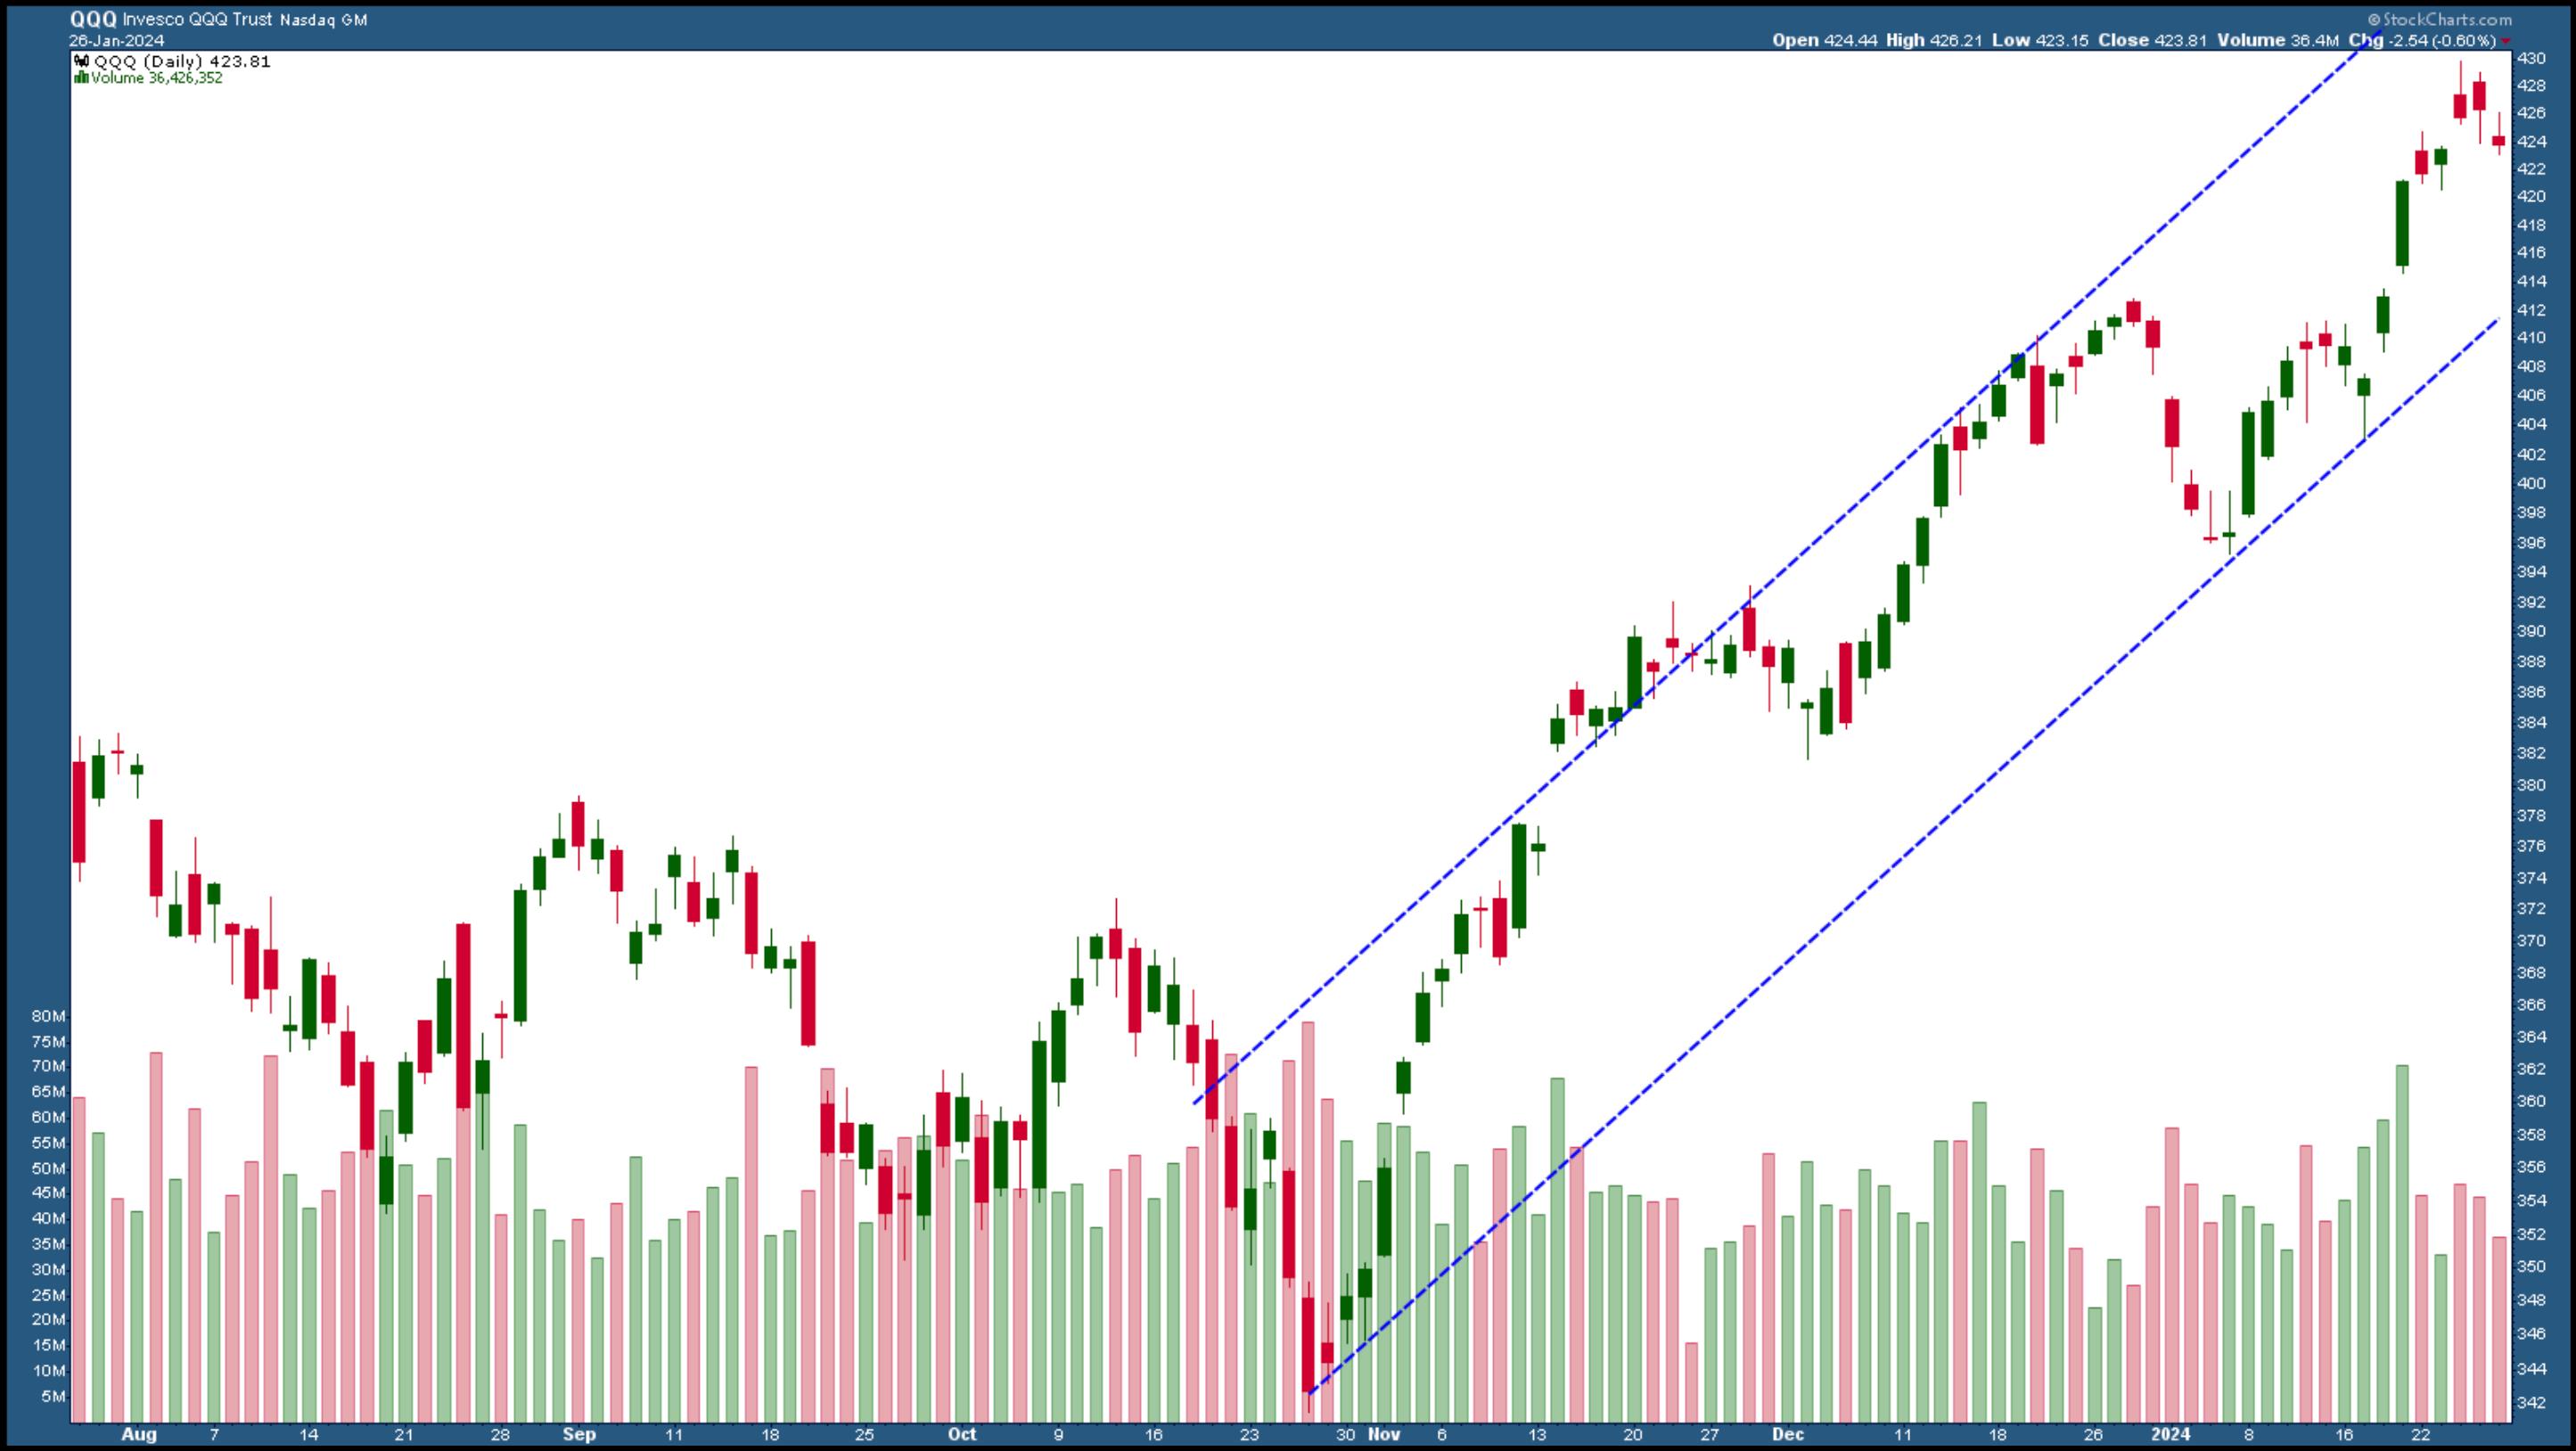
The stock market seems to be content with how the economy is performing. The S&P 500 ($SPX) and Dow Jones Industrial Average ($INDU) have been notching new highs this week. Technology stocks are back in favor, with many Tech and Communication Services reporting earnings next week. Intel's disappointing guidance may have dampened the enthusiasm in Tech, but overall, the sector has been rallying. The Invesco QQQ Trust (QQQ) has been rising since late October 2023 (see chart below).

CHART 1. DAILY CHART OF QQQ. QQQ has been moving in an upward-sloping channel. A break above or below this channel can be an indication to which direction the QQQ will move.Chart source: StockCharts.com. For educational purposes.
Next week, some key tech players will be reporting earnings. Chip stocks are under pressure after Intel's and KLA Corp's weaker guidance. Investors will be closely listening to AMD's earnings next week. Will AMD provide guidance similar to Intel's? If it does, it will send a negative sentiment rippling through the sector. Watch the upward-sloping channel in the QQQ; a break above or below the channel will be an indication of which direction the QQQ will move.
This is why investors should always look at the broad picture when analyzing the stock market.
One useful indicator to follow is the Bullish Percent Index (BPI). It's helpful to have a ChartList of the BPI for the different sectors and major indexes. Looking through the BPI for the 11 S&P sectors, as of now, Consumer Staples, Utilities, and Energy are the only three sectors favoring the bears. But that could change.
Fed Week On the Radar
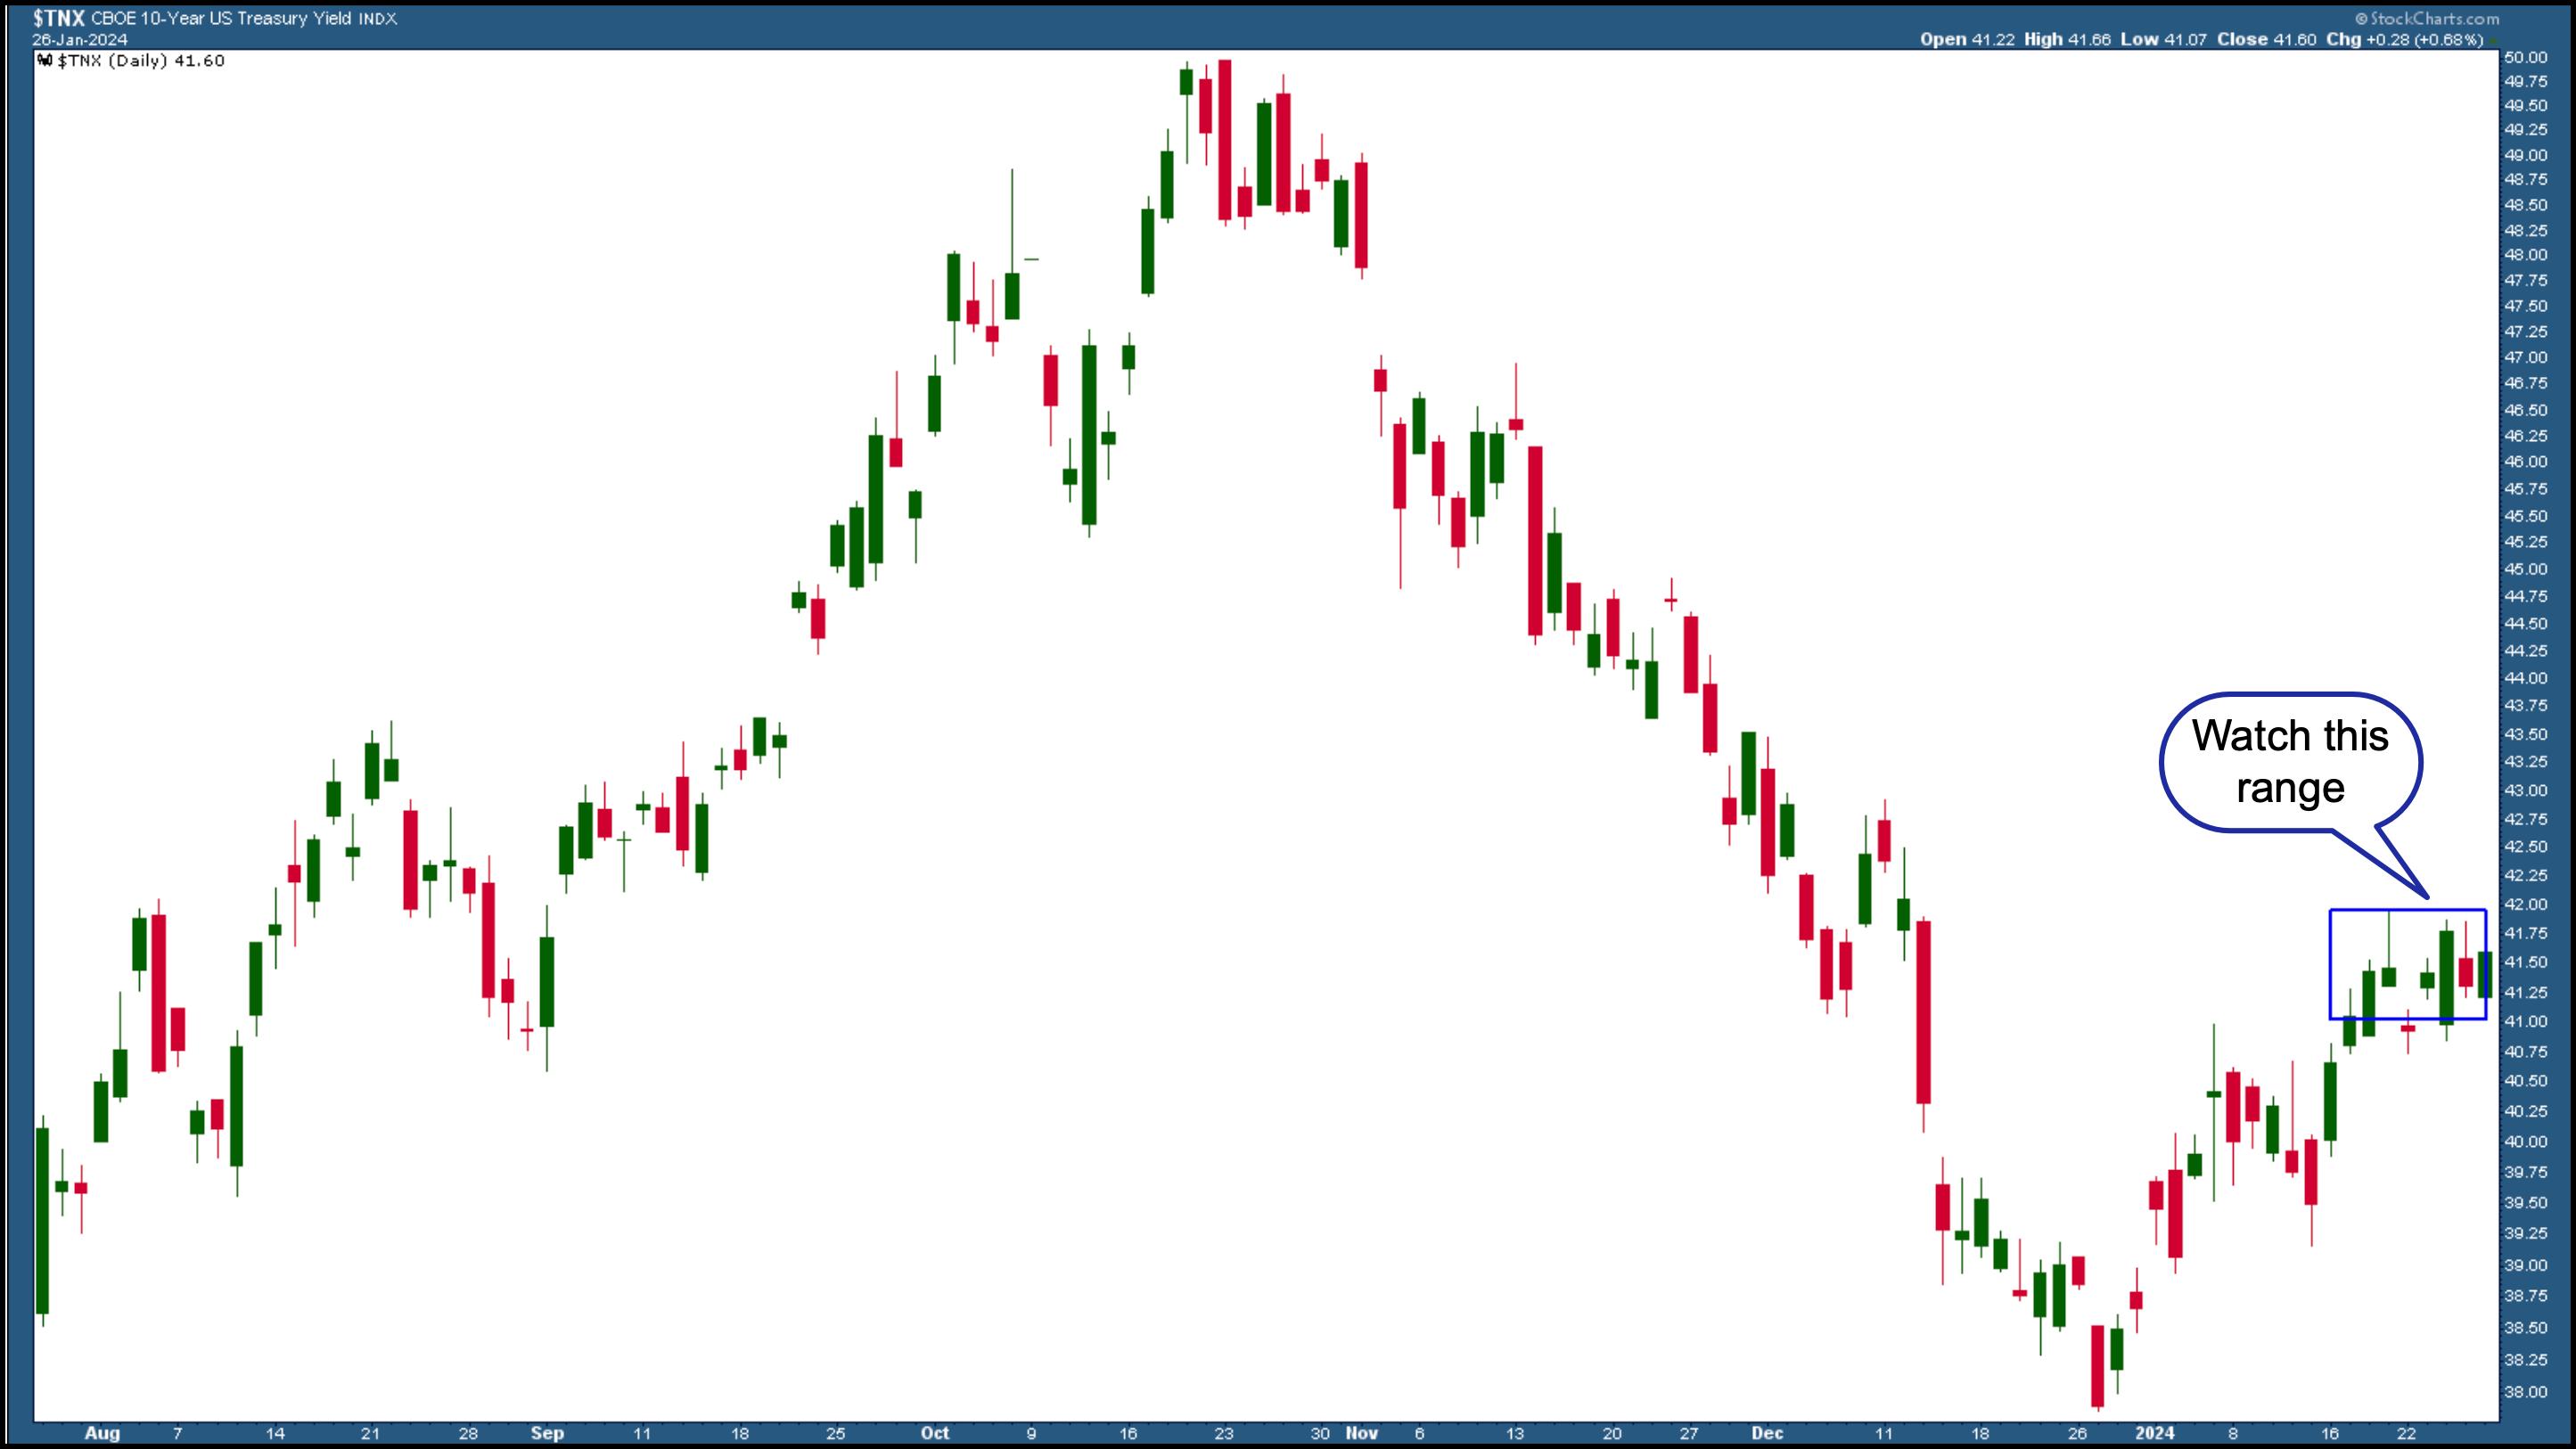
Interestingly, despite the rise in equities, the benchmark US 10-year Treasury yield ($TNX) has stabilized at around the 4.0–4.2% range. Is the bond market telling us something we may not know?

CHART 2. 10-YEAR US TREASURY YIELD STABILIZING. Watch the 10-year Treasury yields as we head into Fed week. They could be telling you something you may have missed.Chart source: StockCharts.com. For educational purposes.
Next week could bring some volatility, with several of the Magnificent Seven reporting next week and the FOMC meeting.
End-of-Week Wrap-Up

- S&P 500 down 0.07% at 38109.43, Dow Jones Industrial Average up 0.16% ; Nasdaq Composite down 0.36% at 15455.36
- $VIX down 1.41% at 13.26
- Best performing sector for the week: Energy
- Worst performing sector for the week: Consumer Discretionary
- Top 5 Large Cap SCTR stocks: Affirm Holdings (AFRM), Super Micro Computer, Inc. (SMCI); Veritiv Holdings, LLC (VRT); Nutanix Inc. (NTNX); CrowdStrike Holdings (CRWD)
On the Radar Next Week
- Earnings week continues, with Advanced Micro Devices (AMD), Alphabet Inc. (GOOGL), Microsoft Corp. (MSFT), Apple Inc. (AAPL), Amazon.com Inc. (AMZN), and Meta Platforms, Inc. (META) reporting.
- Federal Reserve Interest Rate decision
- Jan Non-Farm Payrolls (NFP)
- November S&P/Case-Shiller Home Prices
- Fed Interest Rate Decision
Disclaimer: This blog is for educational purposes only and should not be construed as financial advice. The ideas and strategies should never be used without first assessing your own personal and financial situation, or without consulting a financial professional.
Happy charting!
