TAKEAWAYS
- Stock market breadth is widening which is an indication that market internals are strong
- Falling treasury yields suggest that inflation expectations are declining
- Investors are more complacent than in October which is bullish for equities

Stocks are having a good November, which aligns with typical stock market behavior. According to the Stock Trader's Almanac 2023, both the Wednesday before Thanksgiving and the Friday after have a good track record. So, even though the stock market wraps up at 1 PM on Friday, it may be worth checking your portfolio value. Trading may be thin, since most traders would have taken the day off.
The Dow Jones Industrial Average ($INDU), S&P 500 ($SPX), and Nasdaq Composite ($COMPQ) all closed higher. All three of the indexes are trading close to their all-time highs. Even small- and mid-cap stocks are showing signs of strength. The S&P 600 Small-Cap Index ($SML) and the S&P 400 Mid-Cap Index ($MID) are trading above their yearly lows, but they have much catching up to do before hitting their all-time highs. All S&P sectors except Energy were in the green after Wednesday's close. There was supposed to be an OPEC meeting today to discuss oil production cuts, but it didn't happen.
Overall Market Breadth
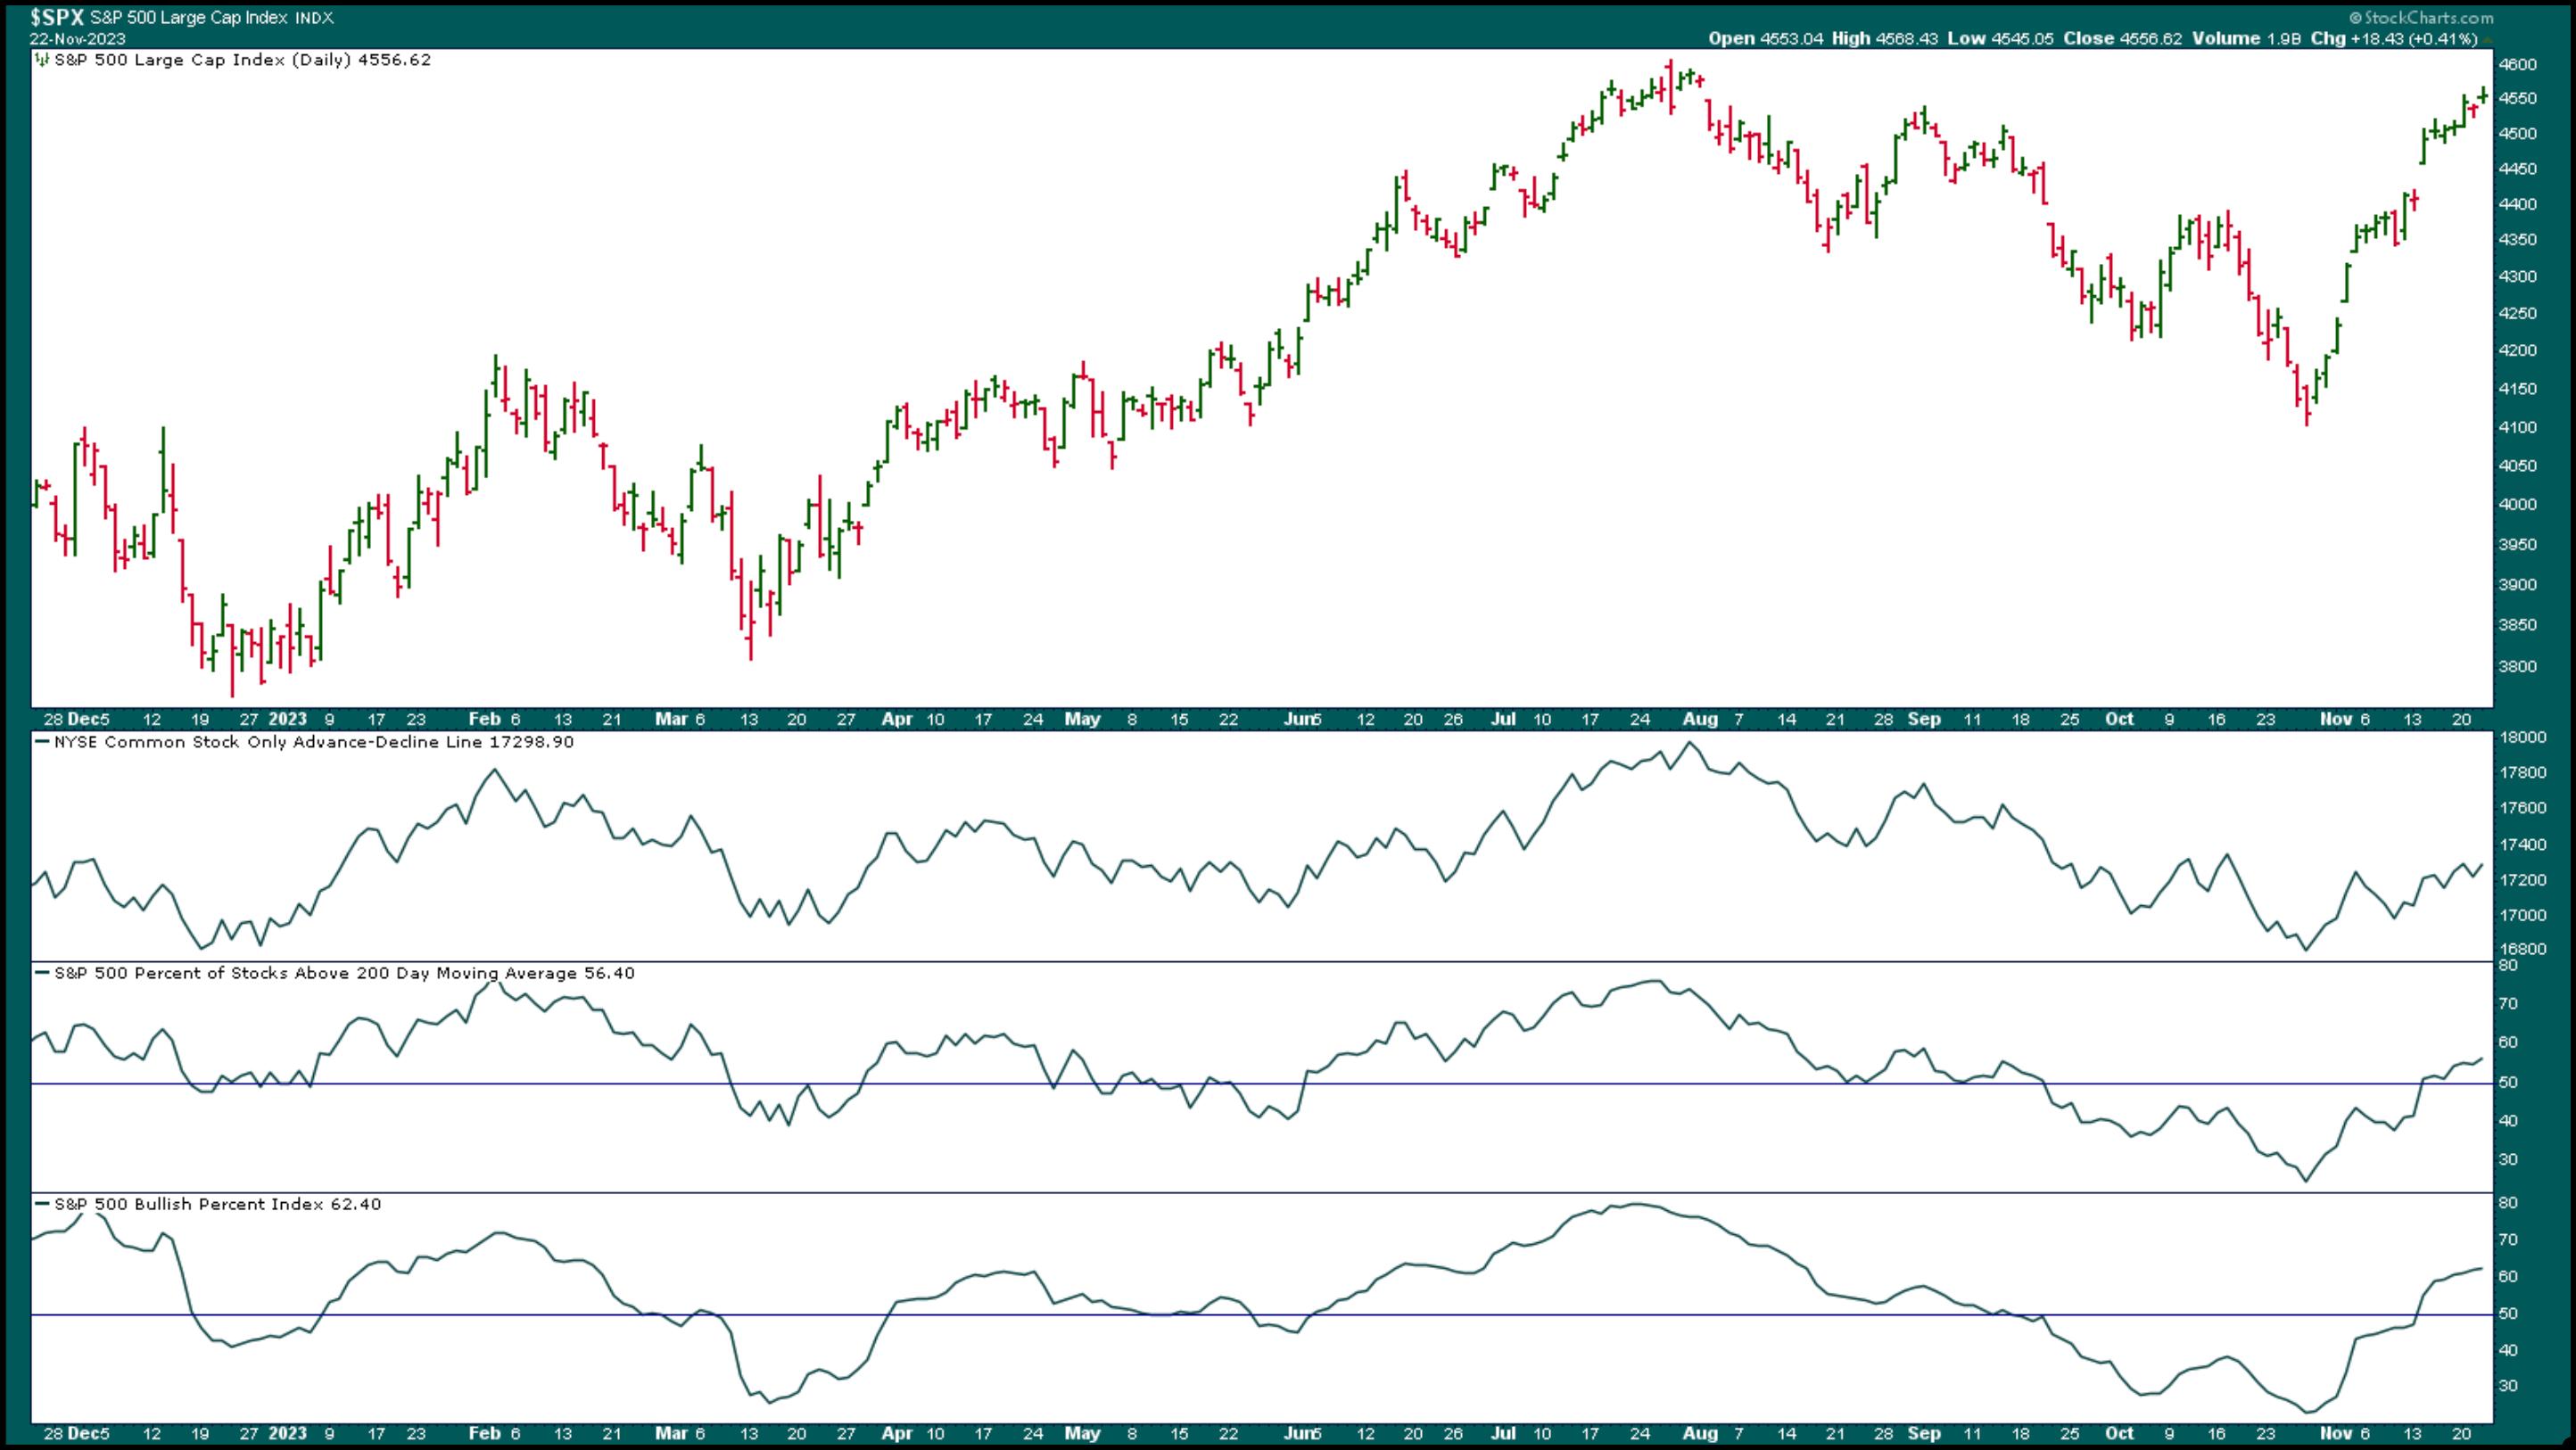
On the equities front, it's encouraging to see market breadth strengthening (see chart below). The NYSE Common Stock Only Advance-Decline line is trending higher, the percentage of stocks trading above their 200-day moving average is at 56.4%, and the S&P 500 Bullish Percent Index at 62.4, above the 50% threshold level. Overall, the S&P 500 and other broader indexes are bullish.

CHART 1: S&P 500 MARKET BREADTH STRENGTHENS. As the S&P 500 approaches its all-time high, it's encouraging to see market breadth widening. Advancers are greater than decliners, the percentage of S&P 500 stocks trading above their 200-day moving average is rising, and the S&P 500 Bullish Percent Index also indicates that investors are bullish.Chart source: StockChart.com. For educational purposes.
Economic data has been mixed. Jobless claims didn't show much weakness and durable goods missed the downside. Earlier in the week, the Fed minutes indicated that the "monetary policy will remain restrictive" narrative is still in play. There was no hint of cutting rates in the near future.
The economic news didn't impact the stock market too much. The November rally is still going strong, with the Nasdaq rallying almost 11%, the Dow up 6.6%, and the S&P 500 up 8.45%.
The Bond Market
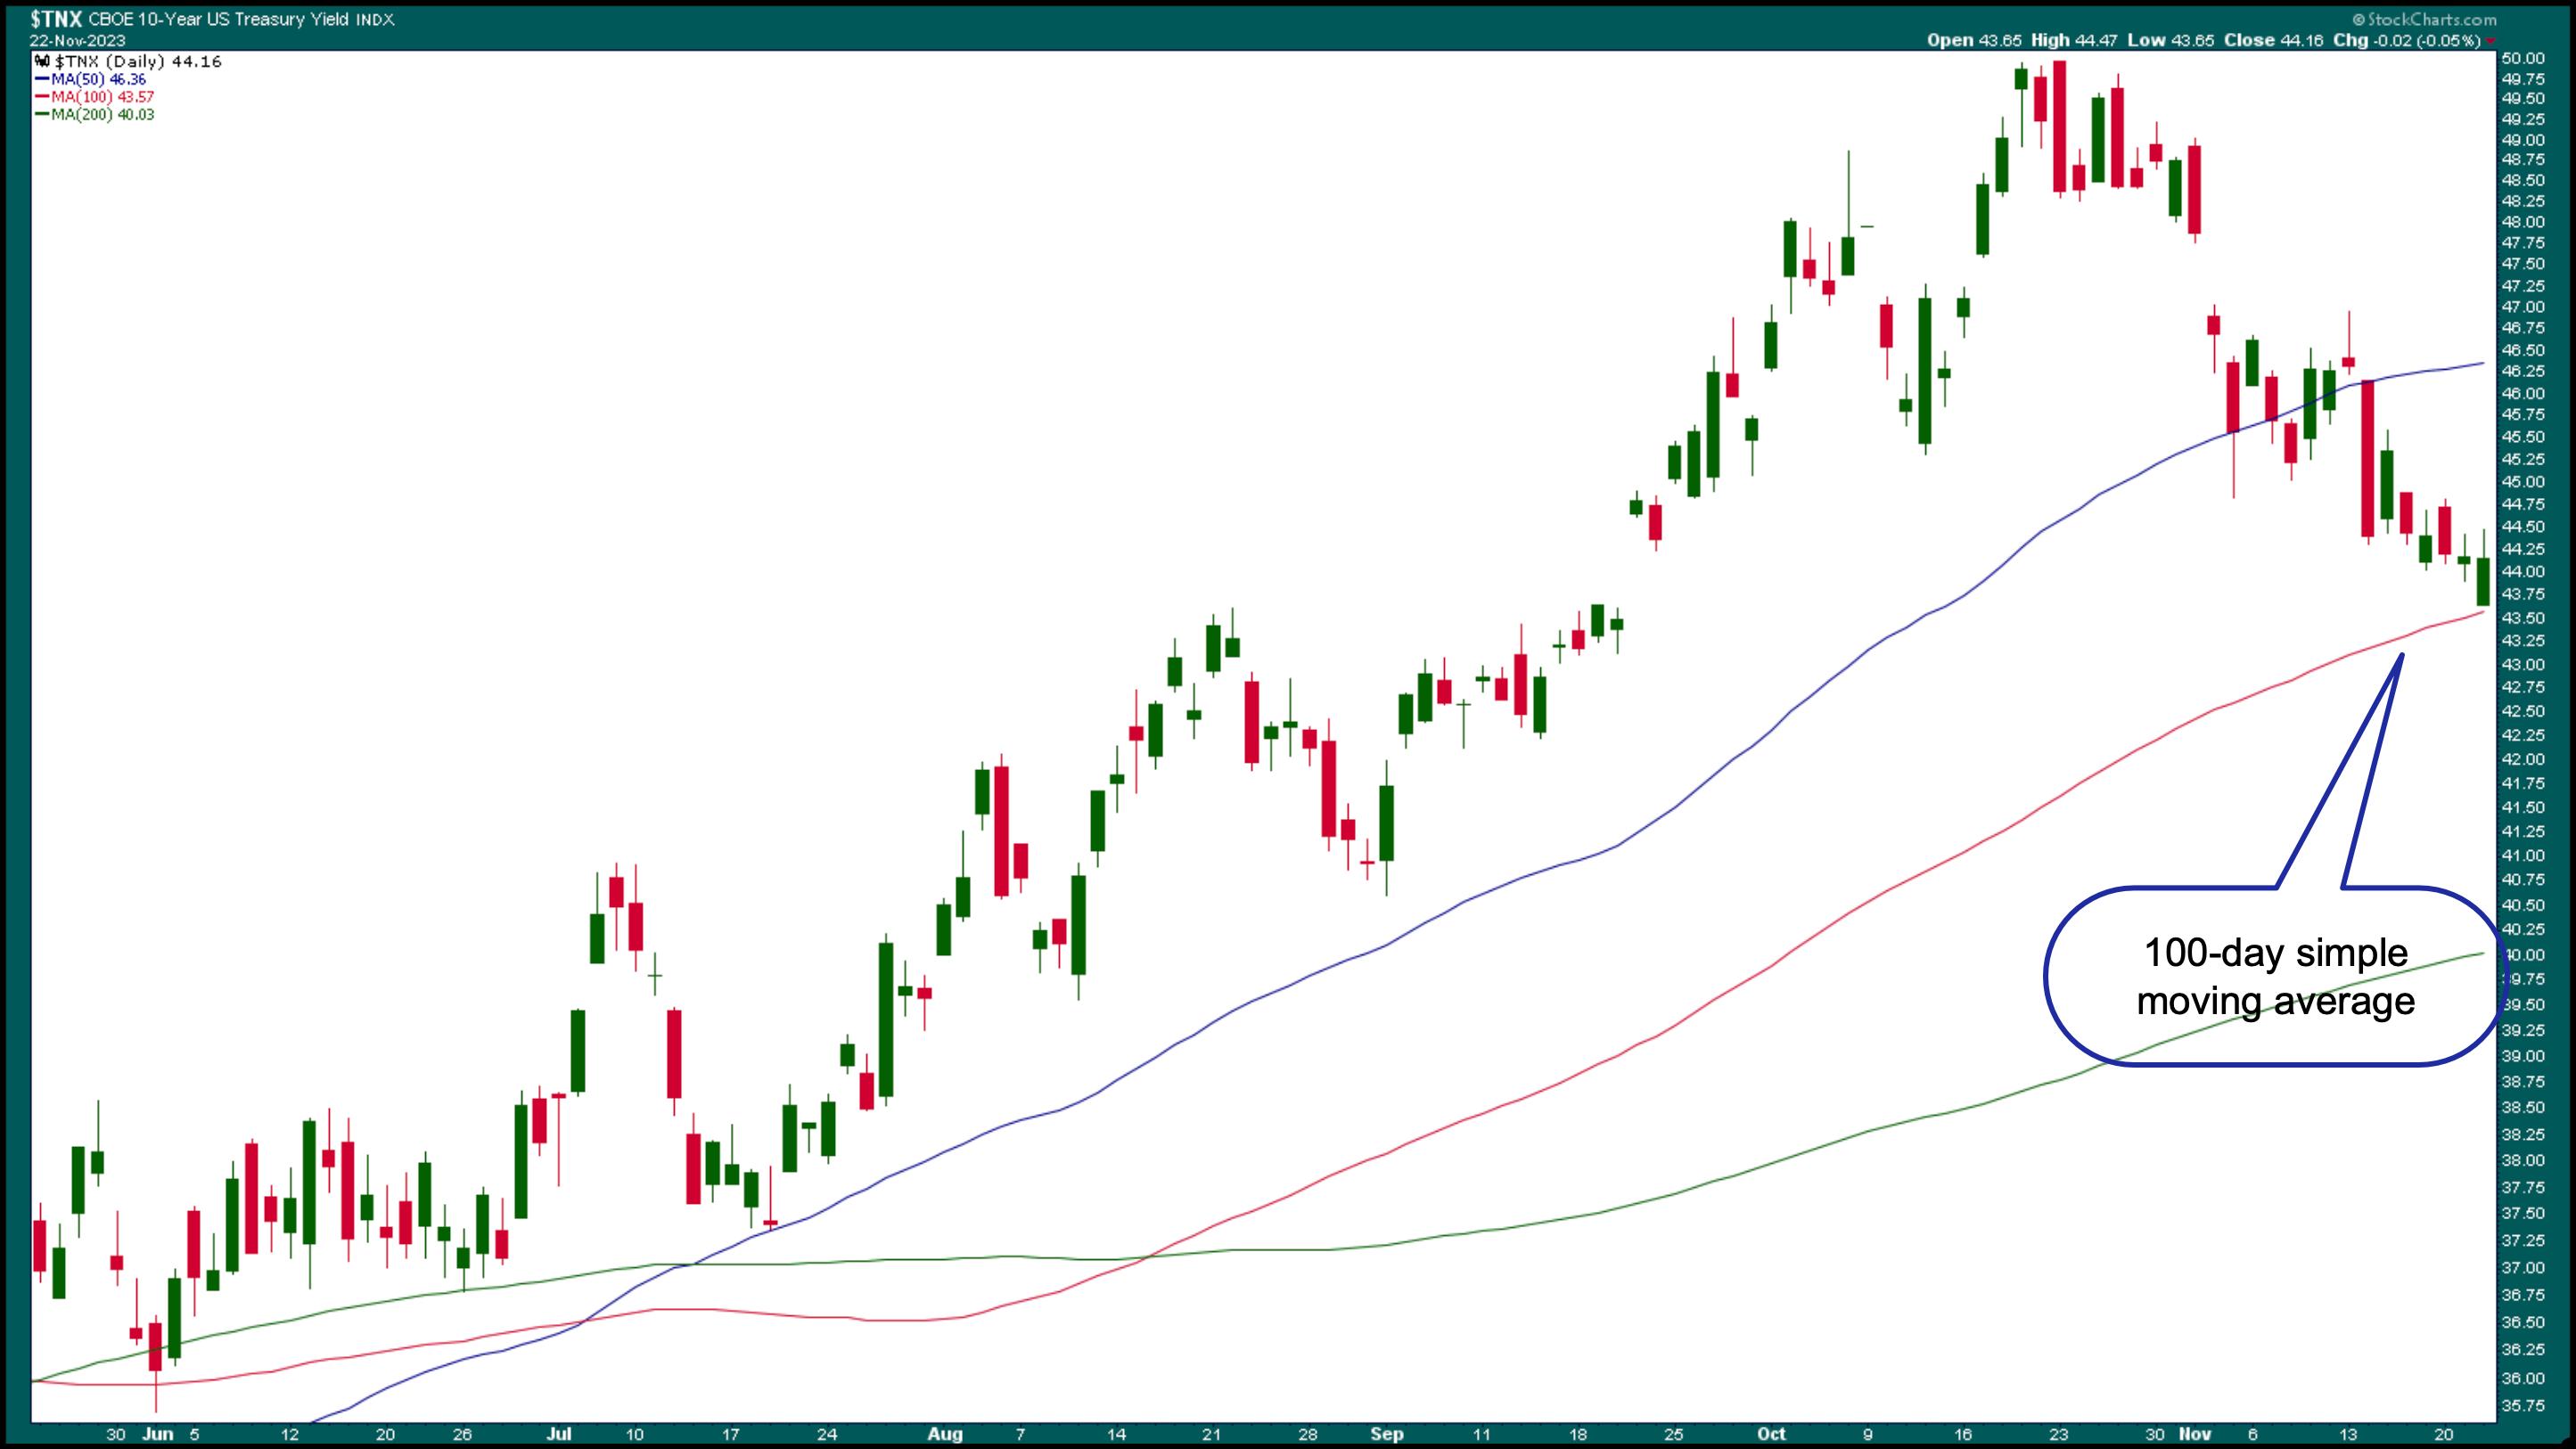
The 10-year US Treasury Yield Index ($TNX) fell to its 100-day simple moving average (SMA), which is acting as a support level. The yield bounced off the SMA and closed at 4.42% (see chart below). Lower yields tend to be good for stocks.

CHART 2: 10-YEAR US TREASURY YIELD INDEX. The 100-day simple moving average could be a support level to watch.Chart source: StockCharts.com. For educational purposes.
Treasury yields move inversely to bond prices, so it's not surprising to see that the iShares 20+ Year Treasury Bond ETF (TLT) has been moving higher. If you've pulled out all your fixed-income investments, now may be time to start thinking about getting back in. But there's no need to rush, since TLT is still a long way for TLT to reach its yearly highs of around $106.
Investor Complacency
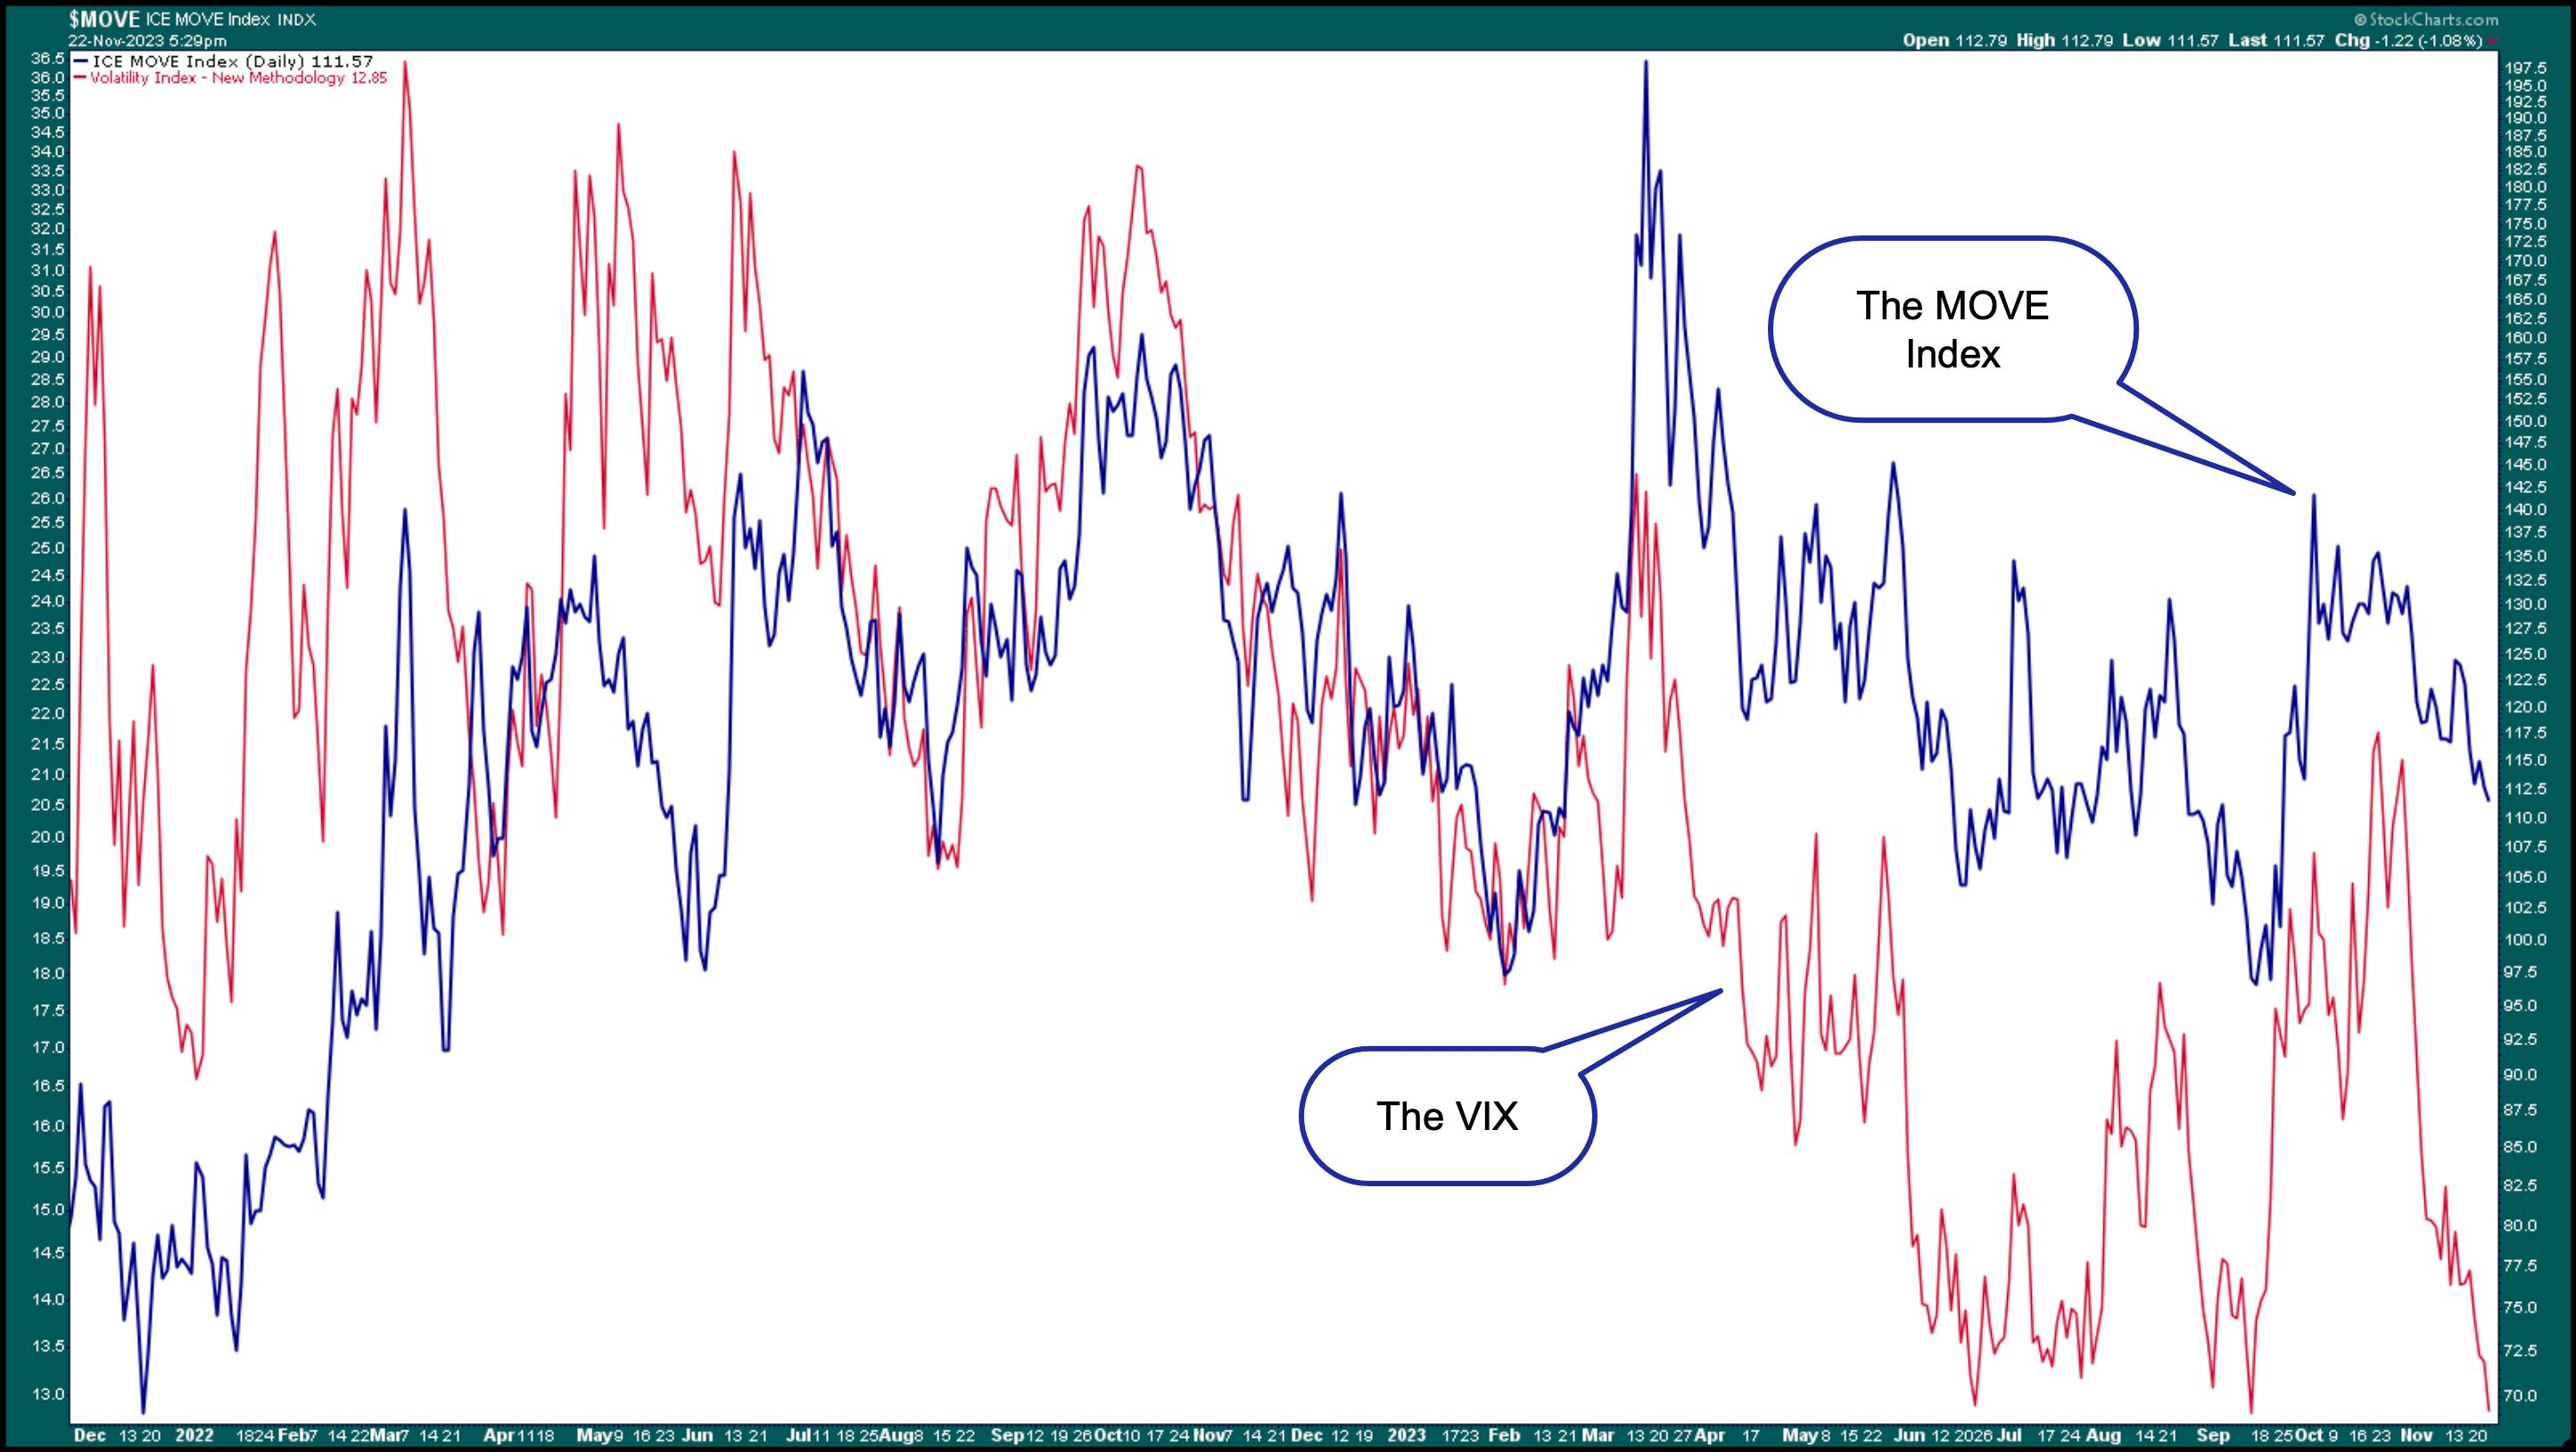
Overall, investor uncertainty has eased considerably since October. The CBOE Volatility Index ($VIX) is very close to its 52-week low, and the MOVE Index, a measure of volatility in the bond market, is also trending lower (see chart below). The VIX closed at 12.85.

CHART 3: STOCK AND BOND VOLATILITY. The VIX (red line) and MOVE (blue line) are moving in the same direction, indicating that stock and bond investors are complacent.Chart source: StockCharts.com. For educational purposes.
Investor complacency could make investors more optimistic and be inclined to take advantage of Black Friday deals.
Black Friday shopping has already started, and retail stocks are showing mixed results. Shares of Amazon (AMZN) are trading close to its 52-week high. It's a similar scenario with Gap, Inc. (GPS) and Ross Stores (ROST). Target (TGT) saw its share price gap up on its recent earnings report. Things weren't the same for Walmart (WMT), with the stock price falling after its recent earnings report. WMT's earnings were strong, but the recent slowdown in consumer spending didn't sit well with investors. But that doesn't mean you should sell the stock. If you look at a weekly chart of WMT, the uptrend in the stock price is still intact.
In Other News
Earnings season may be coming to a close, but NVIDIA was the big one this week, closing lower today in spite of crushing Q3 earnings. Possible restrictions in China's chip exports may have had something to do with the selloff, although some profit-taking ahead of the Thanksgiving holiday shouldn't be alarming. NVDA is still a healthy company with a strong SCTR score and healthy relative strength with respect to the S&P 500.
A Thanksgiving Hope
Even though the stock market's November rally is going strong ahead of the Thanksgiving holiday, there's still a lot of turmoil in this world. Let's hope for steps toward peaceful resolutions.

Disclaimer: This blog is for educational purposes only and should not be construed as financial advice. The ideas and strategies should never be used without first assessing your own personal and financial situation, or without consulting a financial professional.
Happy charting!
