When the stocks of large-cap companies, such as Apple (AAPL), Microsoft (MSFT), Alphabet (GOOGL), Amazon.com (AMZN), and Nvidia (NVDA), keep moving higher and higher in an uncertain economic environment, it can be a cause for concern. Maybe investors have forgotten about these uncertainties surrounding the financial market—inflation is still around, credit conditions are likely to tighten in light of bank struggles, and the debt ceiling has still not been solved. The PCE data released on Friday morning shows that inflation is still a worry. The CME FedWatch Tool shows a higher probability of a 25 basis point rate hike at the next Fed meeting.
So in the midst of these uncertainties, why is there a massive buying surge in a handful of big tech companies? Blame AI.
FOMO on the AI Rally
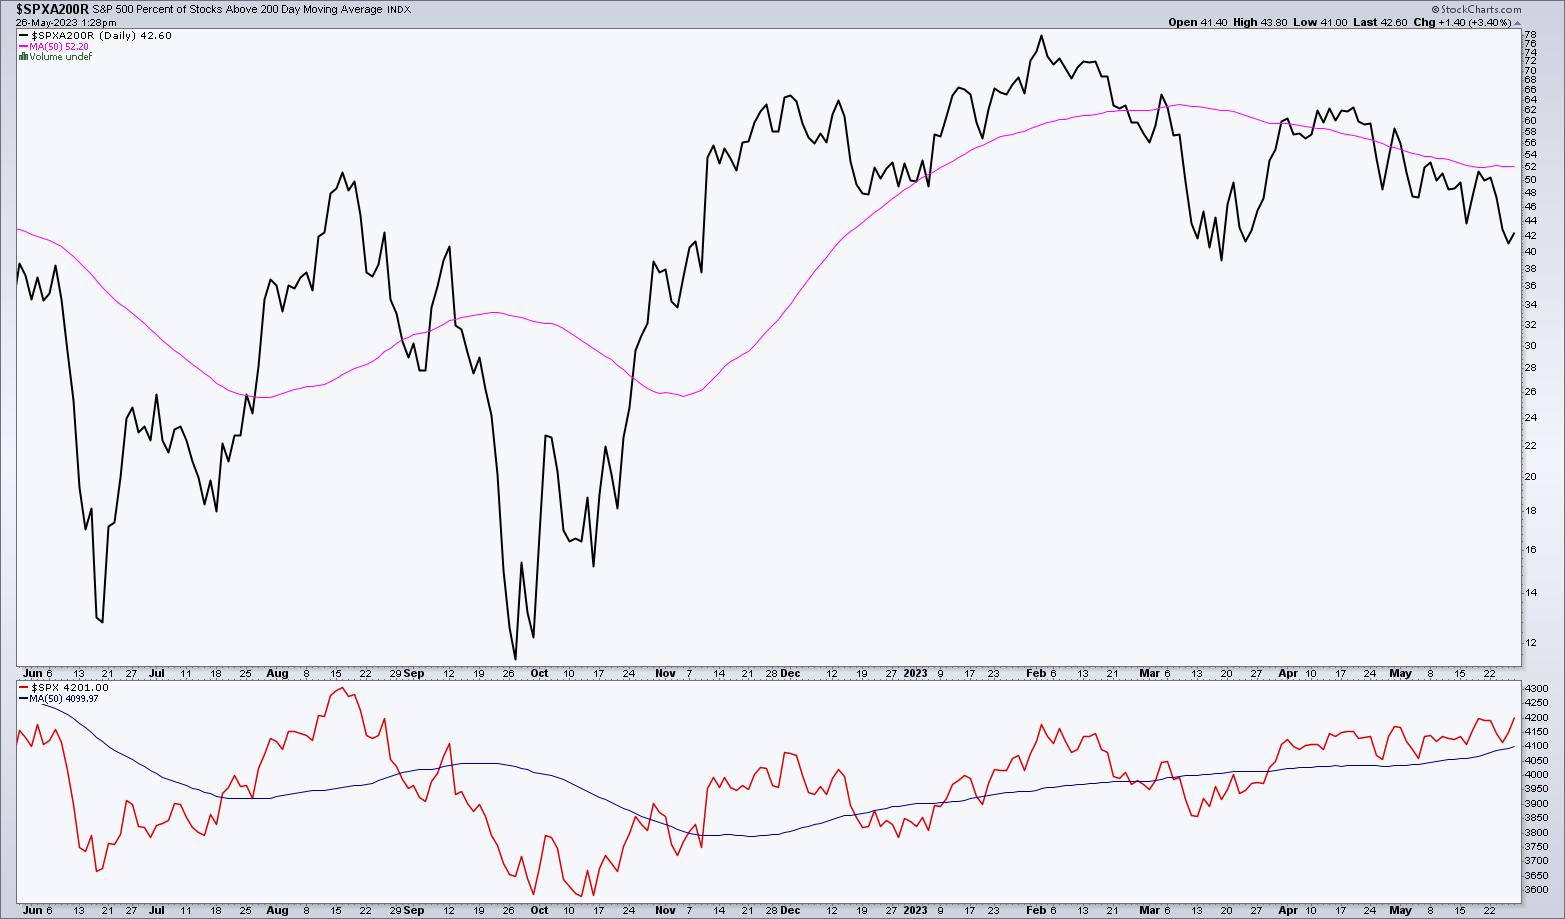
A handful of stocks are riding higher on the AI buzz. Here's what's interesting: if you look at the entire S&P 500 index, its performance isn't in sync with the performance of these top five stocks—AAPL, MSFT, GOOGL, AMZN, and NVDA. These five stocks are trading above their 50-, 100-, and 200-day moving averages. But if you look at the percent of S&P 500 stocks trading above their 200-day moving average ($SPXA200R), it's below the 50% level (see chart below). The chart in the bottom panel is the $SPX, which is trending higher. So there's a divergence between the two.

CHART 1: PERCENTAGE OF S&P 500 STOCKS TRADING ABOVE THEIR 200-DAY MOVING AVERAGE. Even though the S&P index is trending higher, the number of stocks trading above their 200-day moving average is still less than 50%. Chart source: StockCharts.com (click chart for live version). For educational purposes only.
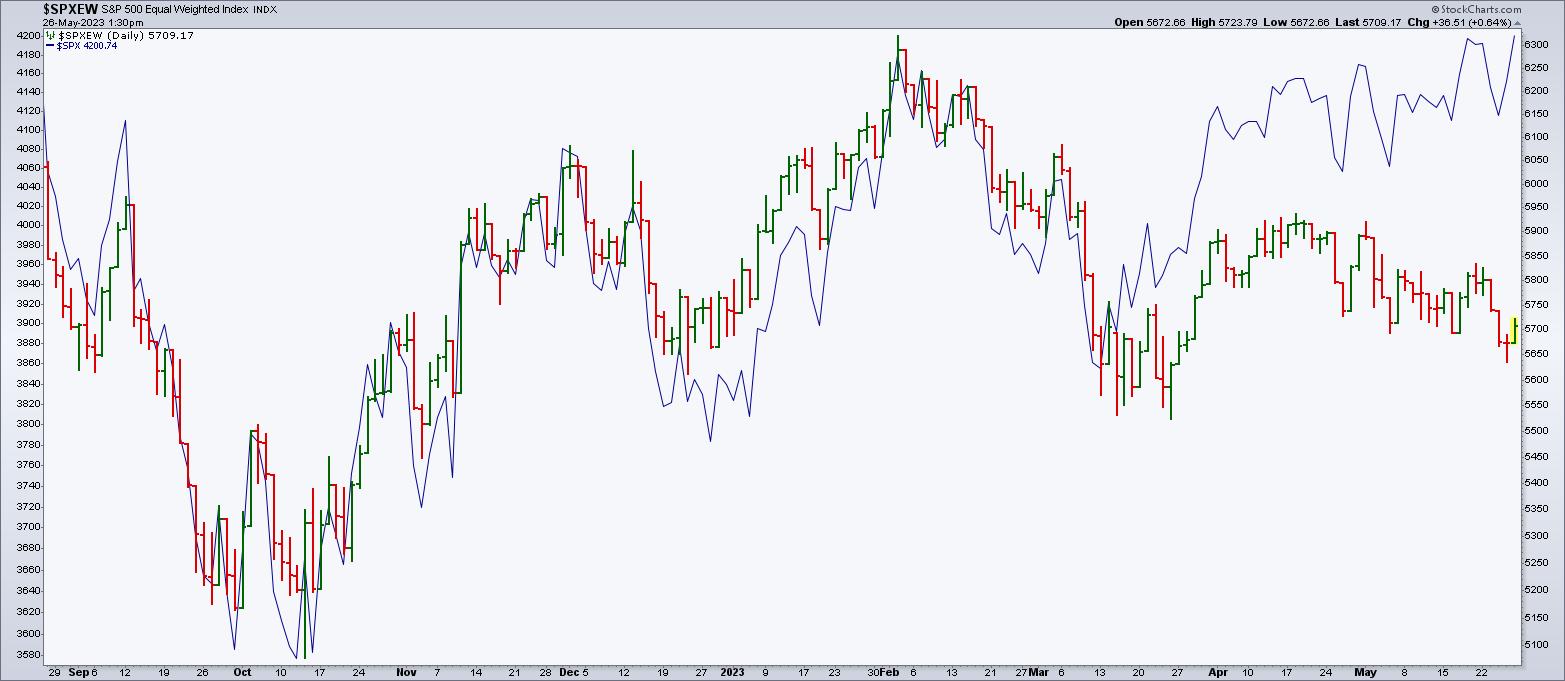
And if you compare the performance of $SPX with the S&P 500 Equal Weighted Index ($SPXEW), the two were pretty correlated until March 2023, when $SPX experienced greater moves (see chart below). Then, from early May, $SPXEW moved lower while $SPX moved higher. The divergence between the two shows that the heavily weighted stocks in the S&P 500 are carrying the index higher.

CHART 2: S&P 500 EQUAL WEIGHTED INDEX VS. S&P 500 INDEX. The S&P 500 equal-weighted index equally weights all the stocks in the index. Notice the divergence between the $SPXEW and $SPX in the last few months.Chart source: StockCharts.com (click on chart for live version). For educational purposes only.
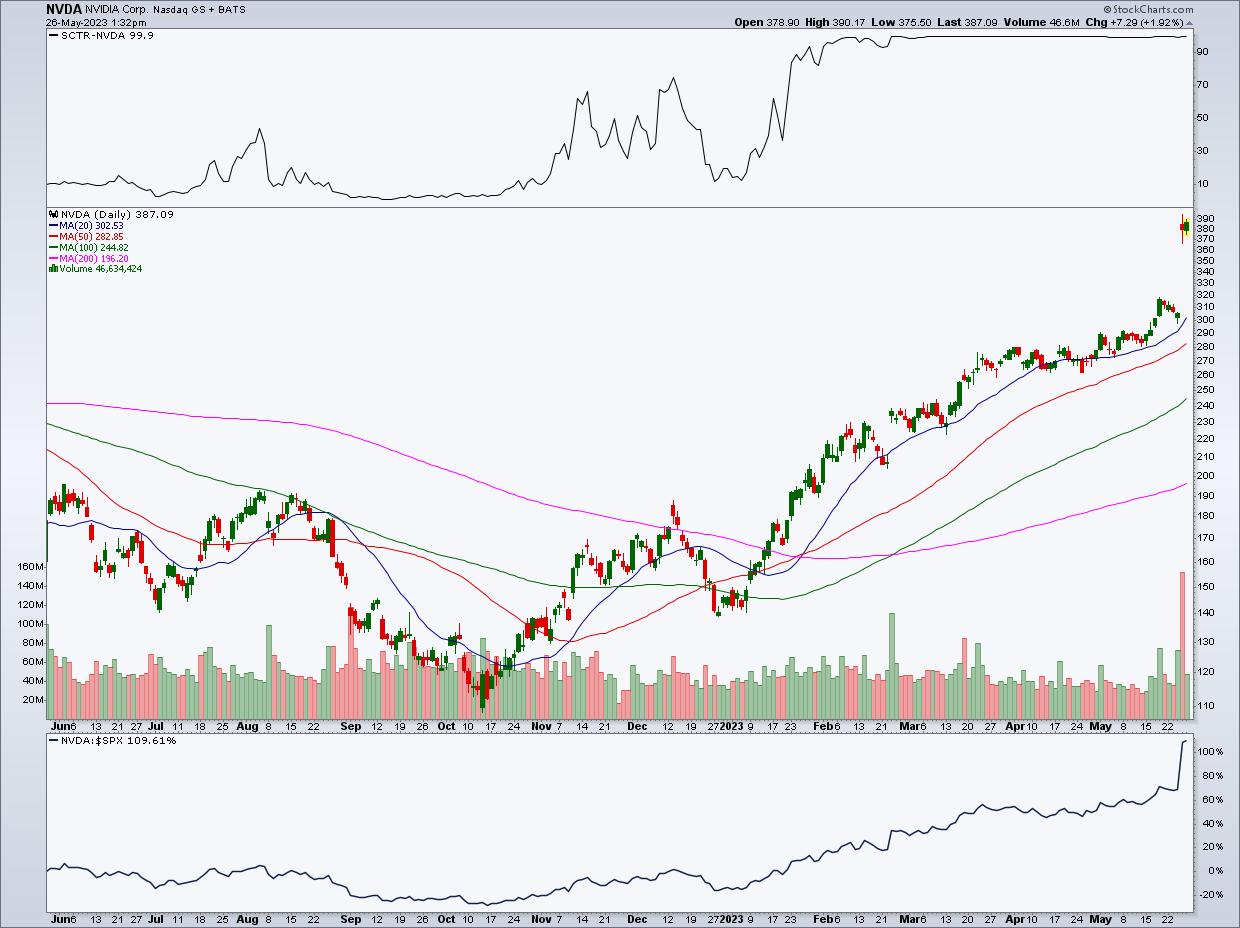
To see how one stock impacts the S&P 500 index, look at how NVDA stock surged after its earnings announcement. The stock made headlines—its market cap almost reached $1 trillion after its earnings boost.
NVDA has had a StockCharts Technical Ranking (SCTR) above 70 since January 2023. And its relative strength against the S&P 500 index ($SPX) spiked along with the stock price after knocking earnings out of the ballpark (see chart below).

CHART 3: IS THE AI RALLY REAL? NVDA is a large AI player with a massive influence in the market. It's spreading its AI love to other big tech stocks.Chart source: StockCharts.com (click chart for live version). For educational purposes only.
When equities keep rising quickly, there's always the fear that prices may fall back to reasonable values. A big question among investors is, "Is there an AI bubble brewing, or is this rally real?" There's a chance that the stock prices of some of the larger, more AI-centric companies could pull back, but, if AI catches on, what about some of the laggards who could also gain from the AI wave?
Most small-cap indexes have some catching up to do to come close to the returns from the Tech sector. If AI does take off as forecasted, then there's a possibility that several companies that will have to adopt AI into their operations could also benefit from the AI surge. This includes many semiconductor companies that have yet to have a stronger hold in the AI department.
Final Thoughts
So if you missed out on the AI rally in the large-cap AI-centric stocks, give it some time. Things could get extremely competitive as more players enter the field, more partnerships are established, and AI broadens its reach across different industries.
The AI excitement makes it look like the market has forgotten about the debt ceiling, inflation, and possible interest rate hikes. That's not to say you shouldn't take advantage of trading opportunities. You should, as long as you do so without losing sight of the big picture. Monitor the fundamentals, market internals, and price action among the market laggards.

Disclaimer: This blog is for educational purposes only and should not be construed as financial advice. The ideas and strategies should never be used without first assessing your own personal and financial situation, or without consulting a financial professional.
Happy charting!
