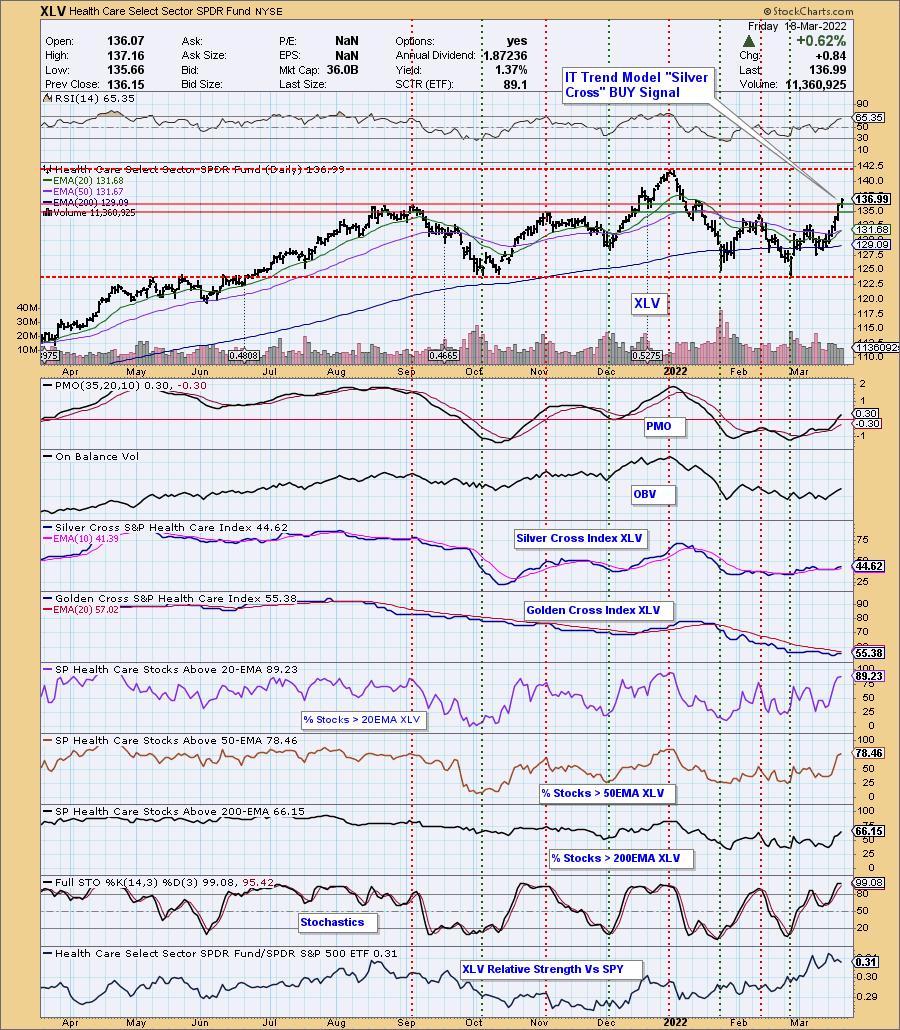
The Health Care sector (XLV) broke out from a strong resistance zone today. Better yet, we saw an IT Trend Model "Silver Cross" BUY signal as the 20-day EMA crossed above the 50-day EMA. There is a lot going for this sector right now; the RSI is positive and not overbought, while the PMO is on a BUY signal and has now moved above the zero line.
Participation within this sector is getting stronger. First, we look at the Silver Cross Index (SCI), which is rising after a recent crossover. It is still below our 70% bullish threshold, but it is rising. It will likely pick up speed given we have 89% of stocks above their 20-day EMA and 78% of stocks above their 50-day EMA. That gives us a bullish bias in the short term.
The Golden Cross Index (GCI), which measures how many stocks within XLV have a 50-day EMA above the 200-day EMA (or stocks that have had golden crosses and are keeping them), is flat and stands at 55%, which is also below our 70% bullish threshold. This gives XLV a long-term bearish bias. However, given that 78% are above their 50-day EMA and 66% are above their 200-day EMA, it should improve soon.

PARTICIPATION and BIAS Assessment: The above chart objectively shows the depth and trend of participation in two time frames.
- Intermediate-Term - the Silver Cross Index (SCI) shows the percentage of SPX stocks on IT Trend Model BUY signals (20-EMA > 50-EMA). The opposite of the Silver Cross is a "Dark Cross" -- those stocks are, at the very least, in a correction.
- Long-Term - the Golden Cross Index (GCI) shows the percentage of SPX stocks on LT Trend Model BUY signals (50-EMA > 200-EMA). The opposite of a Golden Cross is the "Death Cross" -- those stocks are in a bear market.

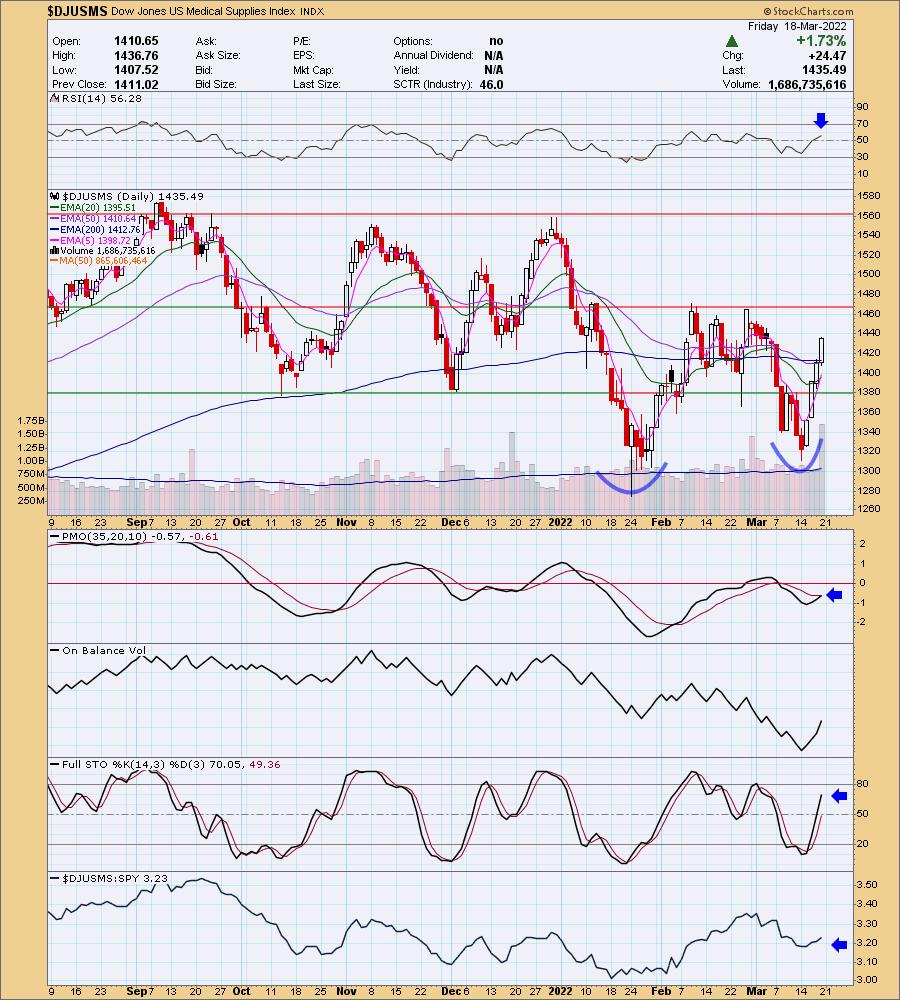
If you review the industry group charts within Healthcare, you'll find that all have bullish configurations. I particularly like Medical Supplies. Note on the chart below that the RSI has just moved positive and the PMO has just generated a new PMO crossover BUY signal. We have a large double-bottom pattern that will be confirmed when price overcomes resistance at 1470. Volume is coming in and relative strength is improving. Stochastics are also rising in positive territory, implying internal strength.

Conclusion: We are likely in the midst of a new bear market rally in the overall market that could turn into the end of the bear market. We won't go that far yet, but we are alert. In the meantime, the Healthcare sector looks like it will profit from a healthy overall market (pun not intended) and could weather through a downturn given the strong participation within.
Good Luck & Good Trading!
Erin Swenlin

Click here to register for the recurring free DecisionPoint Trading Room! Check out her latest recording:
- Topic: DecisionPoint Trading Room
- Start Time: Mar 14, 2022 09:01 AM
- Meeting Recording Link.
- Access Passcode: March@14
Technical Analysis is a windsock, not a crystal ball. --Carl Swenlin
(c) Copyright 2022 DecisionPoint.com
Helpful DecisionPoint Links:
DecisionPoint Alert Chart List
DecisionPoint Golden Cross/Silver Cross Index Chart List
DecisionPoint Sector Chart List
Price Momentum Oscillator (PMO)
Swenlin Trading Oscillators (STO-B and STO-V)
DecisionPoint is not a registered investment advisor. Investment and trading decisions are solely your responsibility. DecisionPoint newsletters, blogs or website materials should NOT be interpreted as a recommendation or solicitation to buy or sell any security or to take any specific action.
