Note that this article has been revised to account for Friday's price action. Stocks were slammed on Black Friday with small-caps leading the way lower and stay-at-home stocks bouncing. The declines were big, but they should be put into perspective. First, Black Friday is pretty much a holiday and trading volume was well below average on the Nasdaq and NYSE. It does not take much to move thin markets. Second, the S&P 500 SPDR (SPY) and the Nasdaq 100 ETF (QQQ), remain in clear uptrends and recently hit new highs. A pullback after a new high is not abnormal and I am not rushing to judgement. Let's get some perspective, discuss the trend-monitoring phase and look at the current setup on SPY.
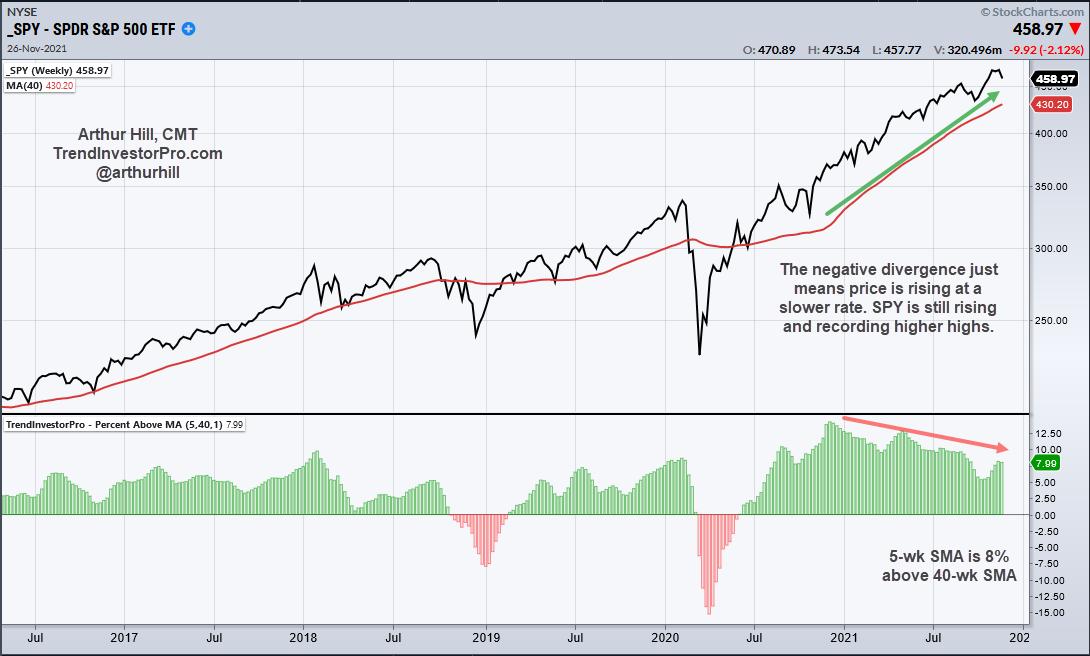
First and foremost, the long-term trend for SPY is up. The chart below shows a simple line chart with weekly closing prices and the 40-week SMA (red line). SPY is near a new high and well above the rising 40-week SMA. The indicator window shows the percentage difference between the 5-week SMA and the 40-week SMA (red/green histogram). This indicator has been green since early June and the 5-week SMA is 7.99% higher than the 40-week SMA. The long-term trend is clearly up.

The indicator formed lower highs throughout 2021, but I do not use negative divergences in my strategy for three reasons. First, the lower highs in the indicator indicate that the advance is slowing, not reversing. Momentum is still positive, just less positive. Second, negative divergences form when price records a higher high. Are higher highs bearish? I think the higher high in SPY is more important here. Third, I am only measuring the trend and the trend is up as long as the 5-week SMA is above the 40-week SMA. Note that this indicator is part of the TrendInvestorPro indicator edge plugin for StockCharts ACP.
There is a clear uptrend and my trading bias is bullish. This means I will look for bullish setups on the daily chart and ignore bearish setups. Trading setups, however, are not always present and this means we must sometimes monitor the trend (trend-monitoring phase) and wait for the next setup.
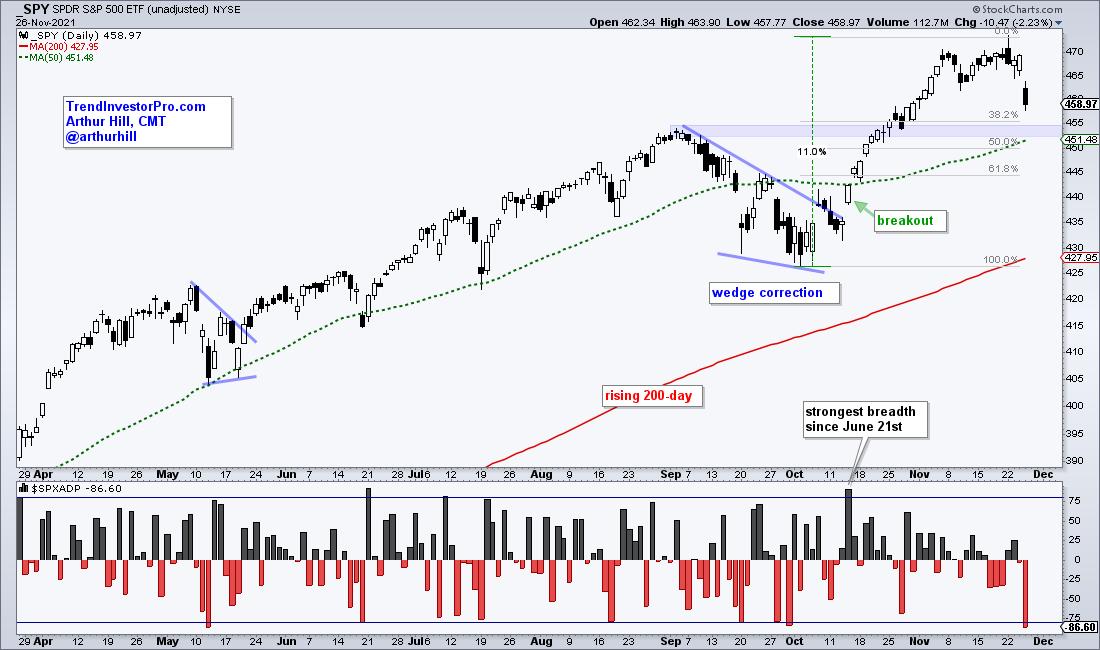
For my style, a bullish setup occurs when SPY becomes short-term oversold, pulls back and/or forms a bullish continuation pattern, such as a falling flag or wedge. The chart below shows the setup that was featured in ChartWatchers on October 15th. SPY pulled back with a falling wedge and broke out with a breadth thrust as S&P 500 AD Percent ($SPXADP) surged above 80%.
Well, that is a great hindsight signal, Art, but what about now? The trend-monitoring phase is when traders wait for the next setup or plan their exits. SPY surged some 10% from early October to late November and is entitled to a pullback. For exits, traders can consider profit targets for all or part of a position or setting a trailing stop. Investors can consider exiting on a bigger trend reversal. Plan that trade and trade that plan.

As far as a setup, I do not see a setup on the chart right now, but one could be in the making. The blue zone marks a possible support/reversal area marked by the rising 50-day SMA, broken resistance and the 38-50% retracements. The resistance breakout represents a victory for demand over supply so we can expect demand in this area. A 38-50% retracement is typical for the ebb and flow of an advance as we see two steps forward and one step backward. Thus, I will be monitoring this area for a bullish setup in the coming days/weeks.
TrendInvestorPro specializes in bullish setups within bigger uptrends and systematic trend-following for ETFs. Note that StockCharts members receive two bonuses when subscribing. First, you get the Master ETF ChartList with 200+ ETFs organized in a logical top-down manner. Second, you get the Essential Breadth Indicator ChartList with over 100 charts covering dozens of breadth indicators. Click here to take your charting to the next level.
--------------------------------
Choose a Strategy, Develop a Plan and Follow a Process
Arthur Hill, CMT
Chief Technical Strategist, TrendInvestorPro.com
Author, Define the Trend and Trade the Trend
Want to stay up to date with Arthur's latest market insights?
– Follow @ArthurHill on Twitter
