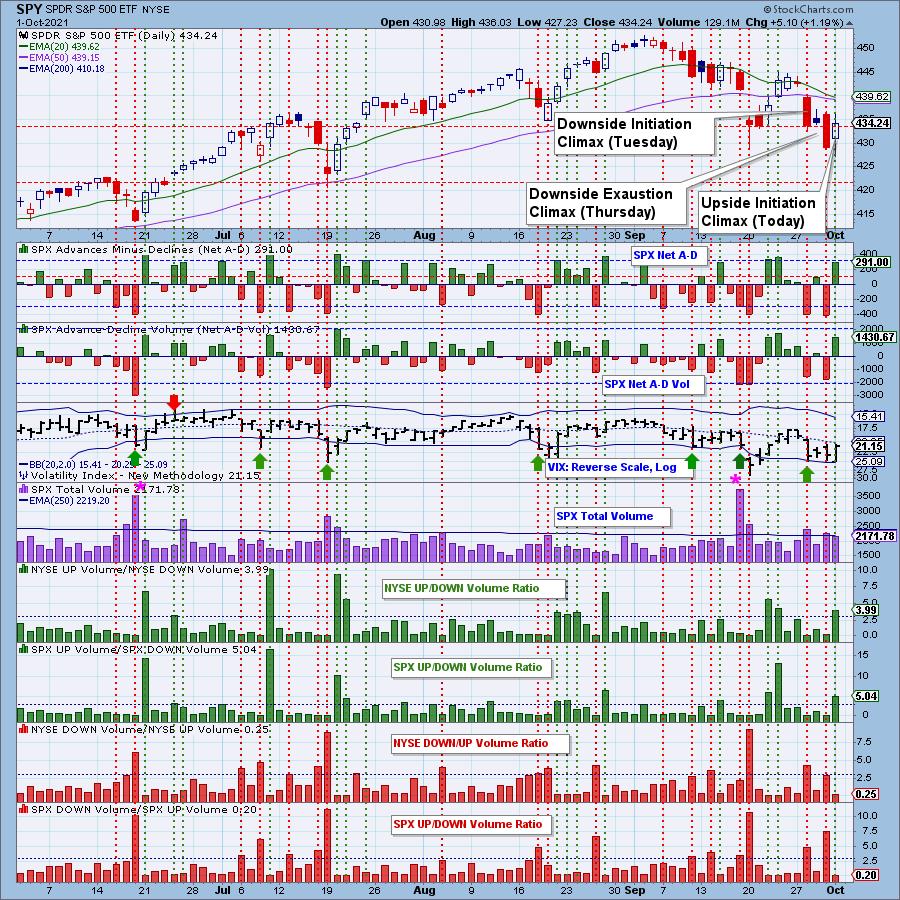
In last week's ChartWatchers newsletter, I wrote about the climax days that occurred the previous week. We saw two more last week and I'll give you the heads up that today we saw an upside initiation climax.
Here's a refresher on what a "climax" is:
A climax is a one-day event when market action generates very high readings in (primarily) breadth and volume indicators. We also include the VIX, watching for it to penetrate outside the Bollinger Band envelope. The vertical dotted lines mark climax days -- red for downside climaxes and green for upside. Climaxes are either initiation or exhaustion.
If you want a more in depth discussion of climax analysis, you can read last week's ChartWatchers article here. Additionally, here is a link to the DecisionPoint show where I discussed climax analysis.
Let's review Tuesday:
You can see that, on the gap down selling, we saw elevated readings on the Volume Ratios, as well as outside readings on many of our indicators. This was an initiation because it arrived at a market top and it followed an upside exhaustion climax the previous week. We didn't see much follow-through on Wednesday, but we definitely saw major selling on Thursday to confirm it. Now we will talk about the climaxes from yesterday and today...

Be alerted after the market close to "Climax Days"! Subscribe to the DecisionPoint Alert!

Try us out for a week! Subscribe to the Bundle package and use Coupon Code: DPTRIAL
On Thursday (yesterday):
We had elevated downside readings on Volume Ratios and Net A-D. This time, it followed that downside initiation. Therefore, we considered it a downside "exhaustion" climax day. We did see follow-through today with a positive close, but we also have a lower low and a lower high. Not particularly impressive. Which leads us into today's upside "initiation" climax.
On Friday (today):
We had robust Volume Ratio readings to the upside. While this was not accompanied by outside readings on Net A-D and Net A-D Volume, those readings were elevated enough to consider this a climax day. It is coming off yesterday's downside "exhaustion" climax, so we believe it to be an upside "initiation" climax, meaning we should look for either sideways churn or higher prices to start the week.
Conclusion: Climax analysis alerts us to very short-term market pivot points. Last week's downside initiation and downside exhaustion climaxes played out as we expected. Today's upside initiation climax holds promise, but we are dealing with a very weak market so we would expect to see churn more than a strong rally early next week.

Click here to register in advance for the recurring free DecisionPoint Trading Room! Recordings are available!
Technical Analysis is a windsock, not a crystal ball.
--Carl Swenlin
(c) Copyright 2021 DecisionPoint.com
Helpful DecisionPoint Links:
DecisionPoint Alert Chart List
DecisionPoint Golden Cross/Silver Cross Index Chart List
DecisionPoint Sector Chart List
Price Momentum Oscillator (PMO)
Swenlin Trading Oscillators (STO-B and STO-V)
DecisionPoint is not a registered investment advisor. Investment and trading decisions are solely your responsibility. DecisionPoint newsletters, blogs or website materials should NOT be interpreted as a recommendation or solicitation to buy or sell any security or to take any specific action.
