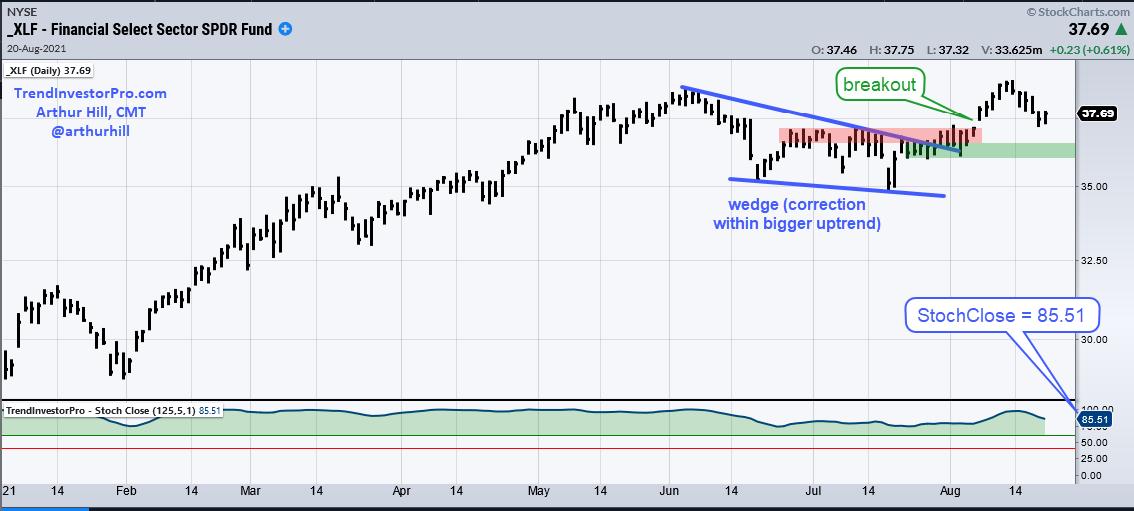
The Finance SPDR (XLF) is one of the leading sectors and recently broke out of a falling wedge correction. There was a little throwback this week, but the breakout is holding and remains bullish until proven otherwise. Let's see what it would take to prove otherwise.
First and foremost, XLF is in a long-term uptrend and one of the leading sectors. The ETF hit a new high last week and StochClose (125,5) is at 85.51 (lower window). This indicator ranges from 0 to 100 and levels above 85 show that price is near a six month high. TrendInvestorPro uses StochClose to rank its core list of 128 ETFs for performance and XLF is in the top quarter. Also note that seven sectors have StochClose values above 85 and are also in the top quarter (XLK, XLC, XLI, XLF, XLV, XLP, XLU, XLRE). No wonder SPY and large-caps are so strong. You can learn more about this indicator on the TIP Indicator Edge Plugin Page.

Turning to the price chart, XLF hit a new high in June and then corrected into July with a falling wedge, a pattern that is typical for a correction within a bigger uptrend. XLF broke out in early August to signal an end to the correction and a resumption of the bigger uptrend. The ETF followed through with a new high and then fell back this week. The late July and early August lows (green shading) mark support and this breakout is considered bullish as long as these lows hold.
TrendInvestorPro uses StochClose for momentum ranking, trend signals and trend-following strategies for ETFs in the All Weather List and the Core List. There is a seven part series for strategies related to this indicator complete with backtest results, both in and out of sample. Click here for immediate access.
-------------------------------------------------
Choose a Strategy, Develop a Plan and Follow a Process
Arthur Hill, CMT
Chief Technical Strategist, TrendInvestorPro.com
Author, Define the Trend and Trade the Trend
Want to stay up to date with Arthur's latest market insights?
– Follow @ArthurHill on Twitter
