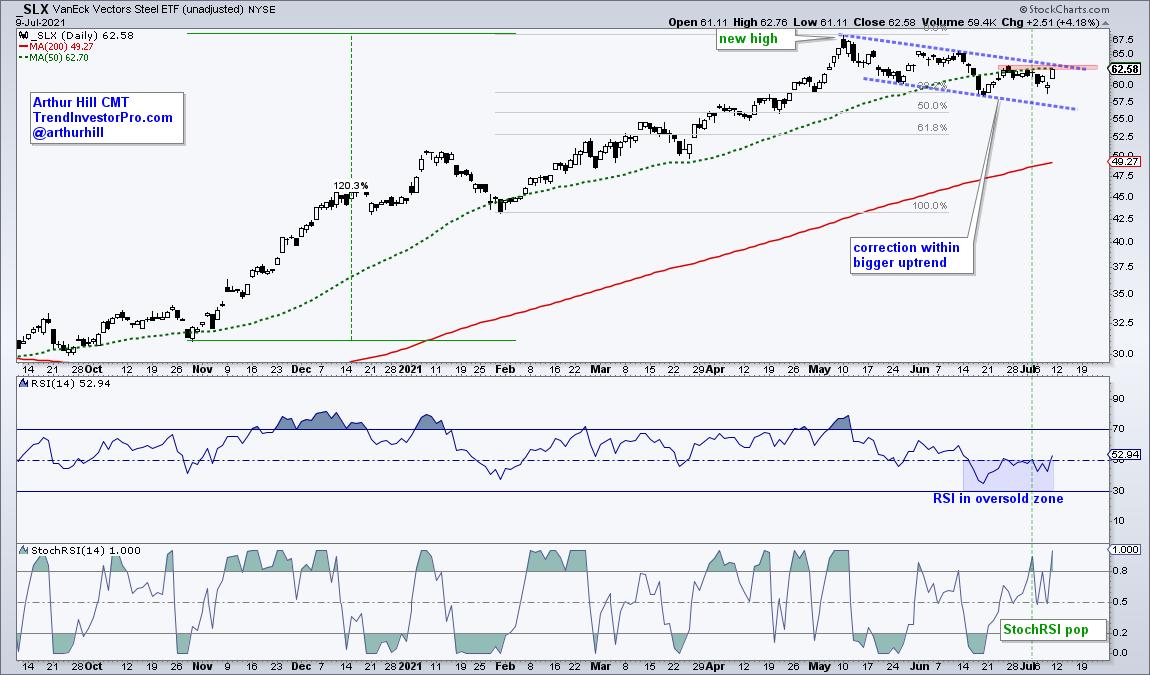
 The Steel ETF (SLX) led the market from late October to early May by more than doubling in price. The ETF then fell back with a break of the 50-day SMA in June, but this decline is viewed as a correction within a bigger uptrend. As such, it represents an opportunity and there are signs that this correction is ending.
First and foremost, the big trend is up and this is the dominant force at work. SLX recorded a 52-week high in early May, price is above the rising 200-day and the 50-day is above the 200-day. The ETF was quite extended in early May as RSI hit 80 and the price gain exceeded 100%. A correction was needed to work off overbought conditions, digest these gains and pave the way to further gains.

SLX obliged with a falling channel that retraced 38-50 percent of the prior advance. Both the retracement amount and the pattern are typical for corrections within a bigger uptrend. Also note that RSI worked off its overbought condition by dipping into the oversold zone (30-50).
Taken together, the channel, the retracement and oversold RSI represent a bullish setup within a bigger uptrend. Now all we need is a trigger. StochRSI surged above .80 last week and this represents a short-term momentum pop. This is the first sign for a short-term bullish reversal. A channel breakout would provide follow through and signal a continuation of the bigger uptrend.
TrendInvestorpPro.com specializes in finding bullish setups for ETFs in long-term uptrends.
--------------------------------------------------
Choose a Strategy, Develop a Plan and Follow a Process
Arthur Hill, CMT
Chief Technical Strategist, TrendInvestorPro.com
Author, Define the Trend and Trade the Trend
Want to stay up to date with Arthur's latest market insights?
– Follow @ArthurHill on Twitter
