(This is an excerpt from today's DecisionPoint Weekly Wrap)
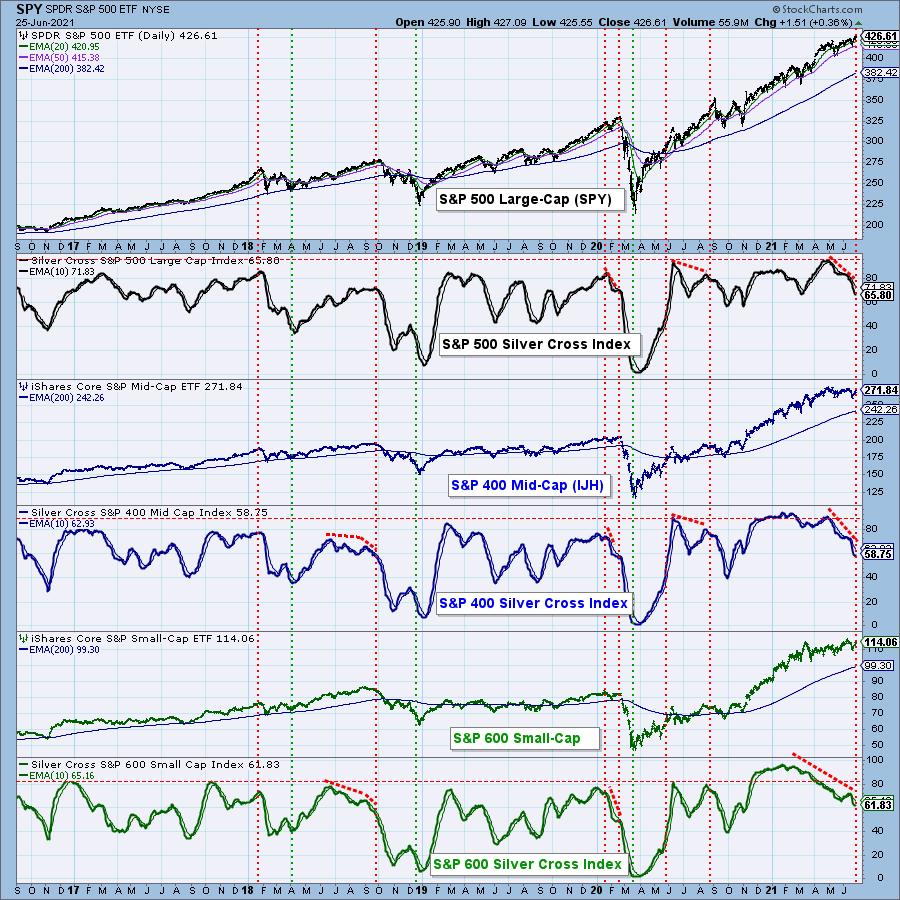
When the 20-EMA crosses up through the 50-EMA, we consider that to be an intermediate-term BUY signal (a "silver cross") and track the percentage of stocks with BUY signals in a given market index with the Silver Cross Index (SCI). The chart below shows the SCIs for the S&P 500 Large-Cap, S&P 400 Mid-Cap and S&P 600 Small-Cap Indexes, and there are significant negative divergences on all three SCIs. Specifically, the price indexes are at or near all-time highs, while all three SCIs show fewer and fewer stocks on BUY signals. To emphasize: This is happening from large-cap to small-cap indexes. This cannot continue.

Don't miss out! Our special will end on July 15th!
Use coupon code SAVE50 and receive your first month of any DecisionPoint publication at 50% off!

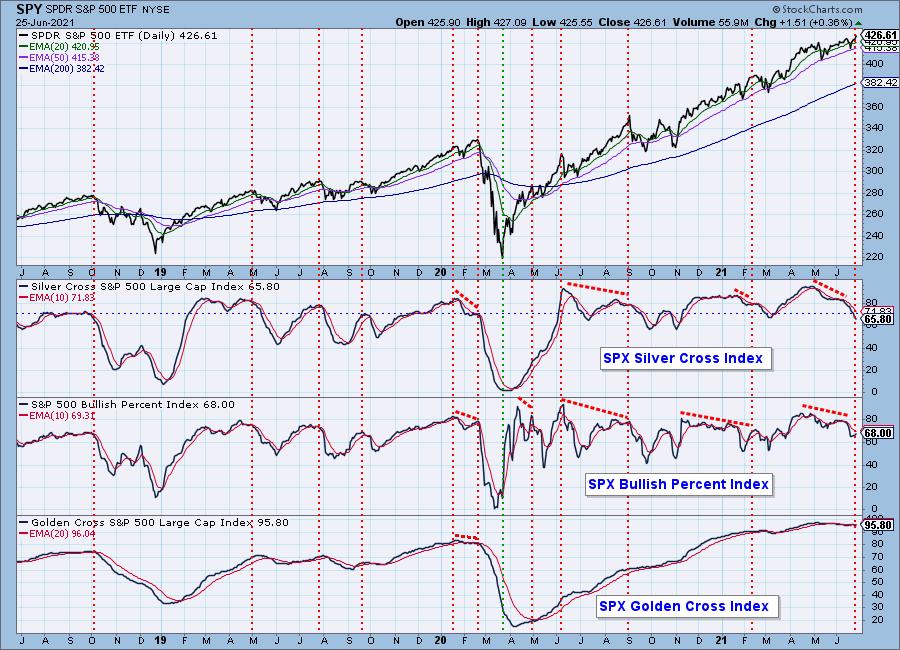
PARTICIPATION: The following chart uses different methodologies for objectively showing the depth and trend of participation for intermediate- and long-term time frames.
- The Silver Cross Index (SCI) shows the percentage of SPX stocks on IT Trend Model BUY signals (20-EMA > 50-EMA).
- The Golden Cross Index (GCI) shows the percentage of SPX stocks on LT Trend Model BUY signals (50-EMA > 200-EMA).
- The Bullish Percent Index (BPI) shows the percentage of SPX stocks on Point & Figure BUY signals.
Fading participation is a huge issue for the market. The Silver Cross Index (SCI) shows only 66% of S&P 500 stocks have the 20EMA above the 50EMA and the trend of the SCI is down. This implies that the larger-cap stocks in the index are holding it up. This condition can persist, but, unless the SCI trend reverses, the tipping point will be reached and we'll see prices hit an air pocket.


Click here to register in advance for the recurring free DecisionPoint Trading Room!
Free DP Trading Room RECORDING LINK from 6/21:
Topic: DecisionPoint Trading Room
Start Time: Jun 21, 2021 08:49 AM
Free DP Trading Room (6/21) Recording Link.
Access Passcode: June-21st
For best results, copy and paste the access code to avoid typos.
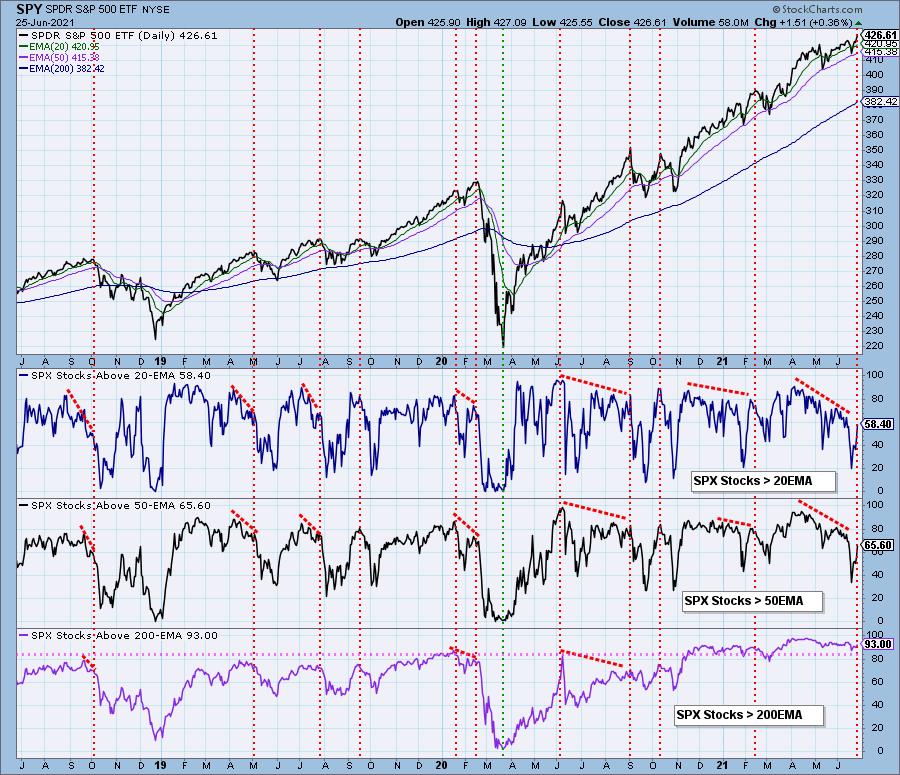
There are still sharp negative divergences on the Stocks > 20EMA and Stocks > 50EMA even with the improved readings this week.

Conclusion: Fading participation and negative divergences suggest the current short-term and intermediate-term rising trends are in jeopardy.
Happy Charting!
- Carl & Erin
Technical Analysis is a windsock, not a crystal ball.
Helpful DecisionPoint Links:
DecisionPoint Alert Chart List
DecisionPoint Golden Cross/Silver Cross Index Chart List
DecisionPoint Sector Chart List
Price Momentum Oscillator (PMO)
Swenlin Trading Oscillators (STO-B and STO-V)
DecisionPoint is not a registered investment advisor. Investment and trading decisions are solely your responsibility. DecisionPoint newsletters, blogs or website materials should NOT be interpreted as a recommendation or solicitation to buy or sell any security or to take any specific action.

