This is an excerpt from today's subscriber-only "DecisionPoint Weekly Wrap":
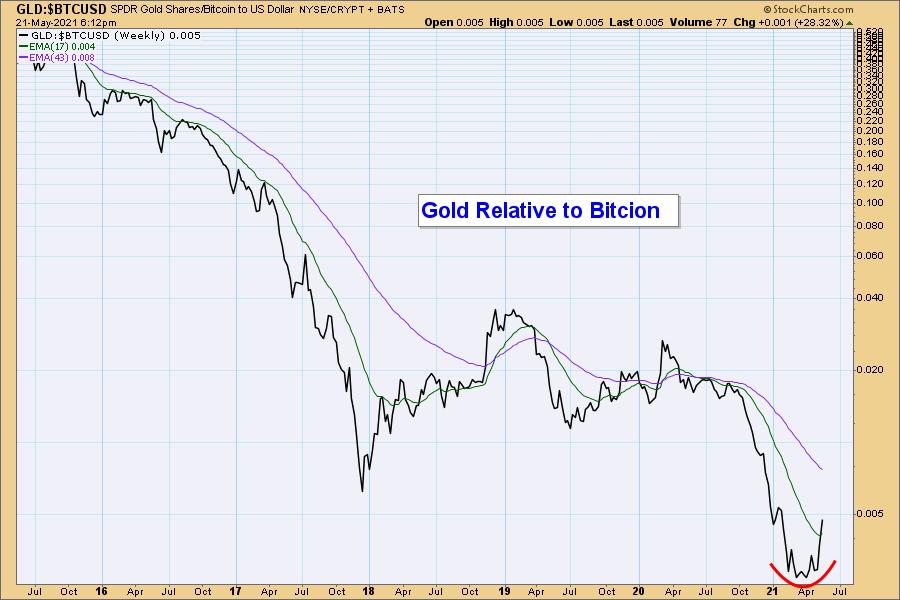
It has long been our belief that gold should be doing a lot better, considering the reckless spending and borrowing that is currently in progress. We have also believed that billions of dollars being diverted into Bitcoin (and other cryptos) is the reason for gold's poor performance. In his recent The 10th Man newsletter, Jared Dillion included a chart showing the relative strength of gold versus Bitcoin that offered hope that this detrimental trend may be about to reverse. Here is our version of that chart. Note the rounded bottom forming this year, the result of sudden crypto weakness versus relatively steady gold prices. No guarantees, but we think that the rounded bottom is more promising than the spike bottom we saw in 2017. Let's take a look at Bitcoin and Gold next.
ChartWatchers SPECIAL:
50% off your first month of any of subscriptions!
Just enter coupon code: SAVE50 at checkout!
CLICK HERE TO LEARN MORE!


Click here to register in advance for the recurring free DecisionPoint Trading Room! Recordings are available!
Bitcoin
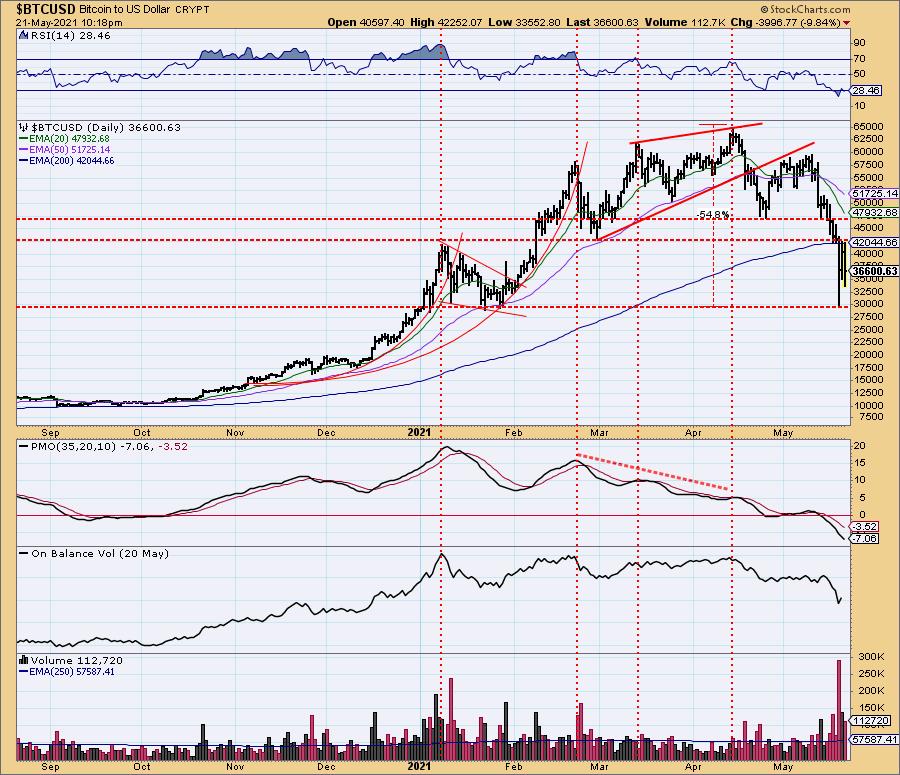
Bitcoin has been in decline since mid-April, and this week some major selling took place. Intraday on Wednesday, Bitcoin was down nearly -55% from its April top. The rounded top formed over the last several months looks like a major top. Reported on Fox Business: "The IRS disclosed Thursday 'businesses that receive crypto assets with fair market value of more than $10,000' will need to be reported." We can be sure more regulation of crypto is on the way, and that will not be favorable to crypto prices moving higher. Is crypto becoming a crypt?
Gold
IT Trend Model: BUY as of 5/3/2021
LT Trend Model: BUY as of 5/21/2021
GOLD Daily Chart: We are declaring an LT Trend Model BUY signal as of today. The 50-EMA is just a hair away from crossing up through the 200-EMA. Technically, we should wait for the actual crossover to change the signal, but price is well above the moving averages, and the crossover should happen Monday. Might as well anticipate it.
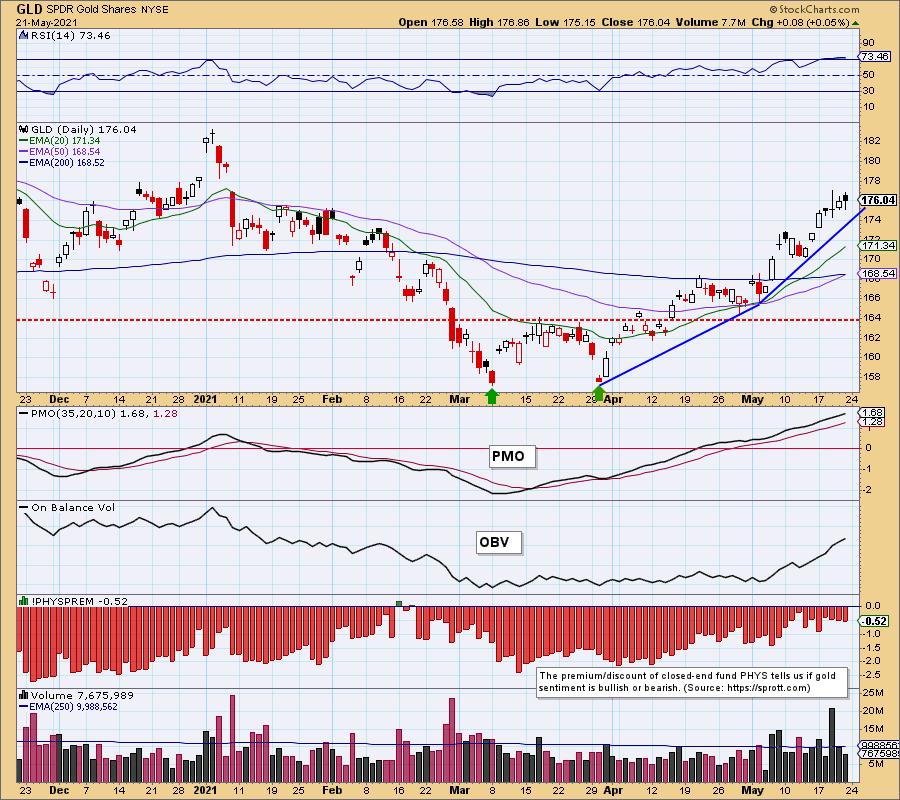
It is obvious that the rising trend for gold from the March low is accelerating. That, combined with this week's breakout, could result in some snapback or consolidation soon.
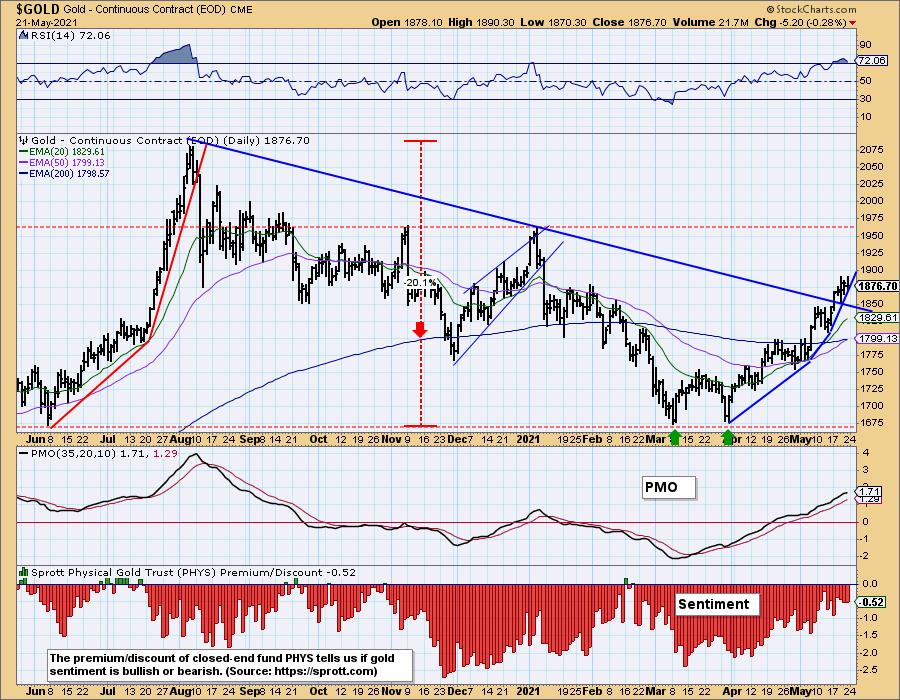
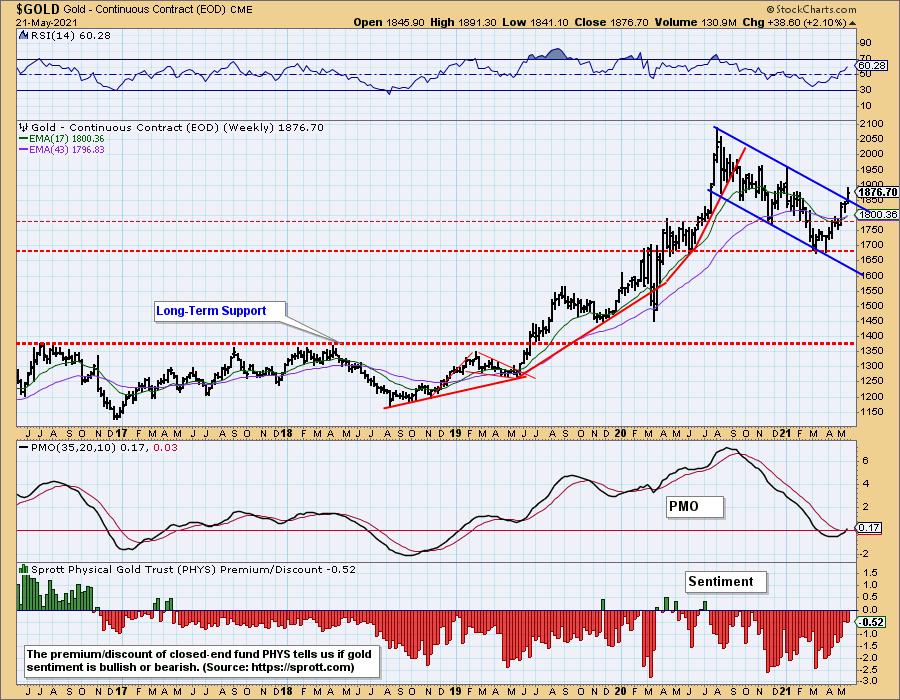
GOLD Weekly Chart: A breakout and a solid weekly PMO bottom and crossover BUY signal are most encouraging.
Happy Charting!
- Carl
Technical Analysis is a windsock, not a crystal ball.
Helpful DecisionPoint Links:
DecisionPoint Alert Chart List
DecisionPoint Golden Cross/Silver Cross Index Chart List
DecisionPoint Sector Chart List
Price Momentum Oscillator (PMO)
Swenlin Trading Oscillators (STO-B and STO-V)
DecisionPoint is not a registered investment advisor. Investment and trading decisions are solely your responsibility. DecisionPoint newsletters, blogs or website materials should NOT be interpreted as a recommendation or solicitation to buy or sell any security or to take any specific action.
