Relative strength is one of the most important parts of my technical toolkit. Basically, the idea is to lean into stocks that are working and lean away from stocks that are not working. If that sounds easy, simple and straightforward, that's because it is!
This week, I noticed one group in particular that was demonstrating strong price and relative strength profiles. In this article, we'll break down the homebuilder stocks along with two popular ETFs to gain exposure to the space.
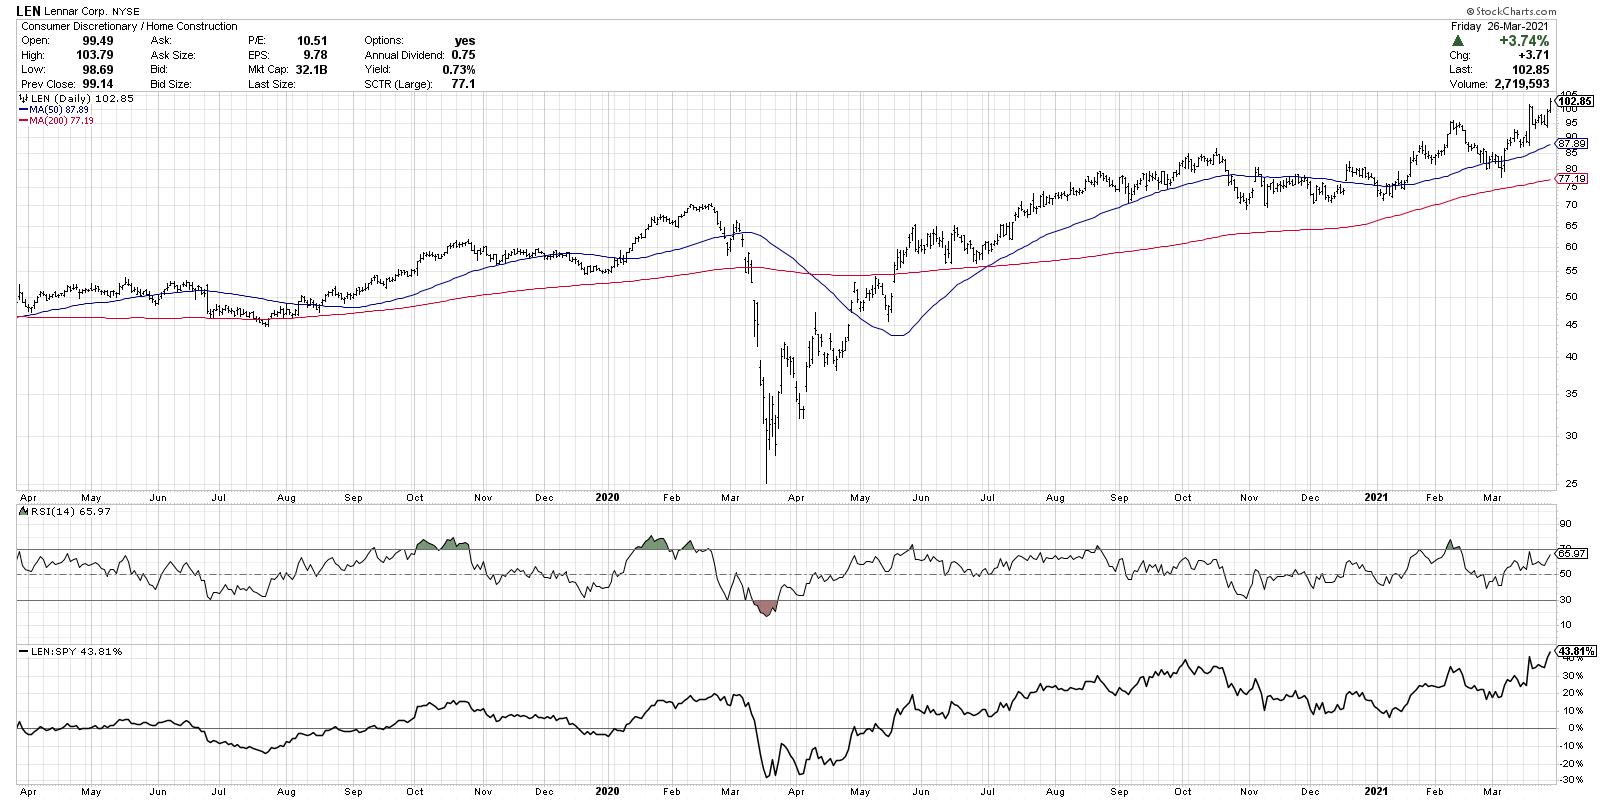
The chart of Lennar Corp (LEN) below shows strong relative performance from the March 2020 market low to the end of September.

Notice how the relative strength turned down in the 4th quarter of last year, as LEN remained in a sideways consolidation phase while the S&P 500 pushed to higher highs in November and December. Once the new year began, Lennar resumed its uptrend and has handily outperformed the S&P 500 benchmark for the last three months.
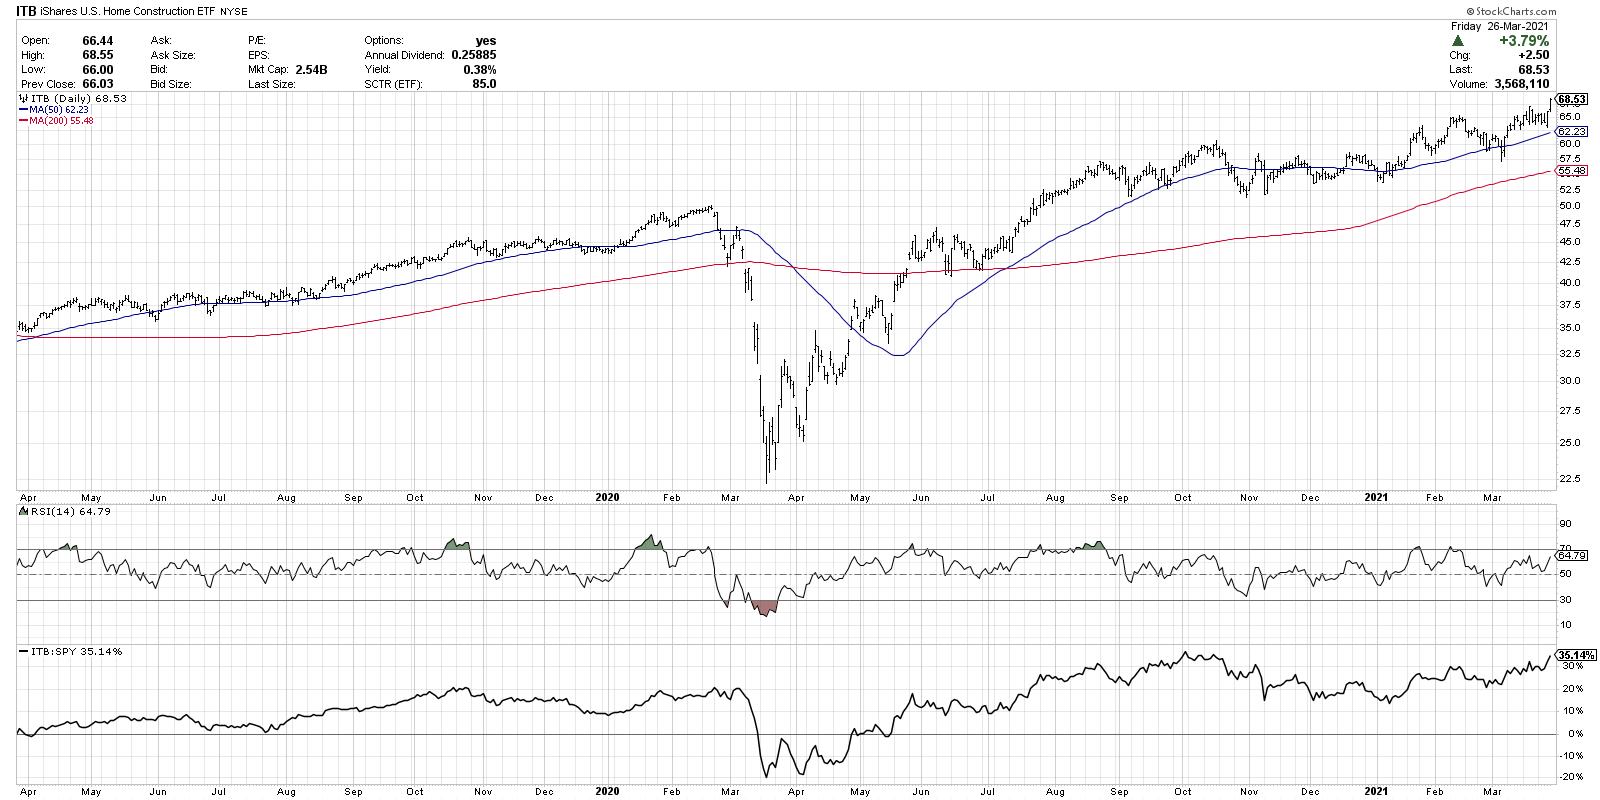
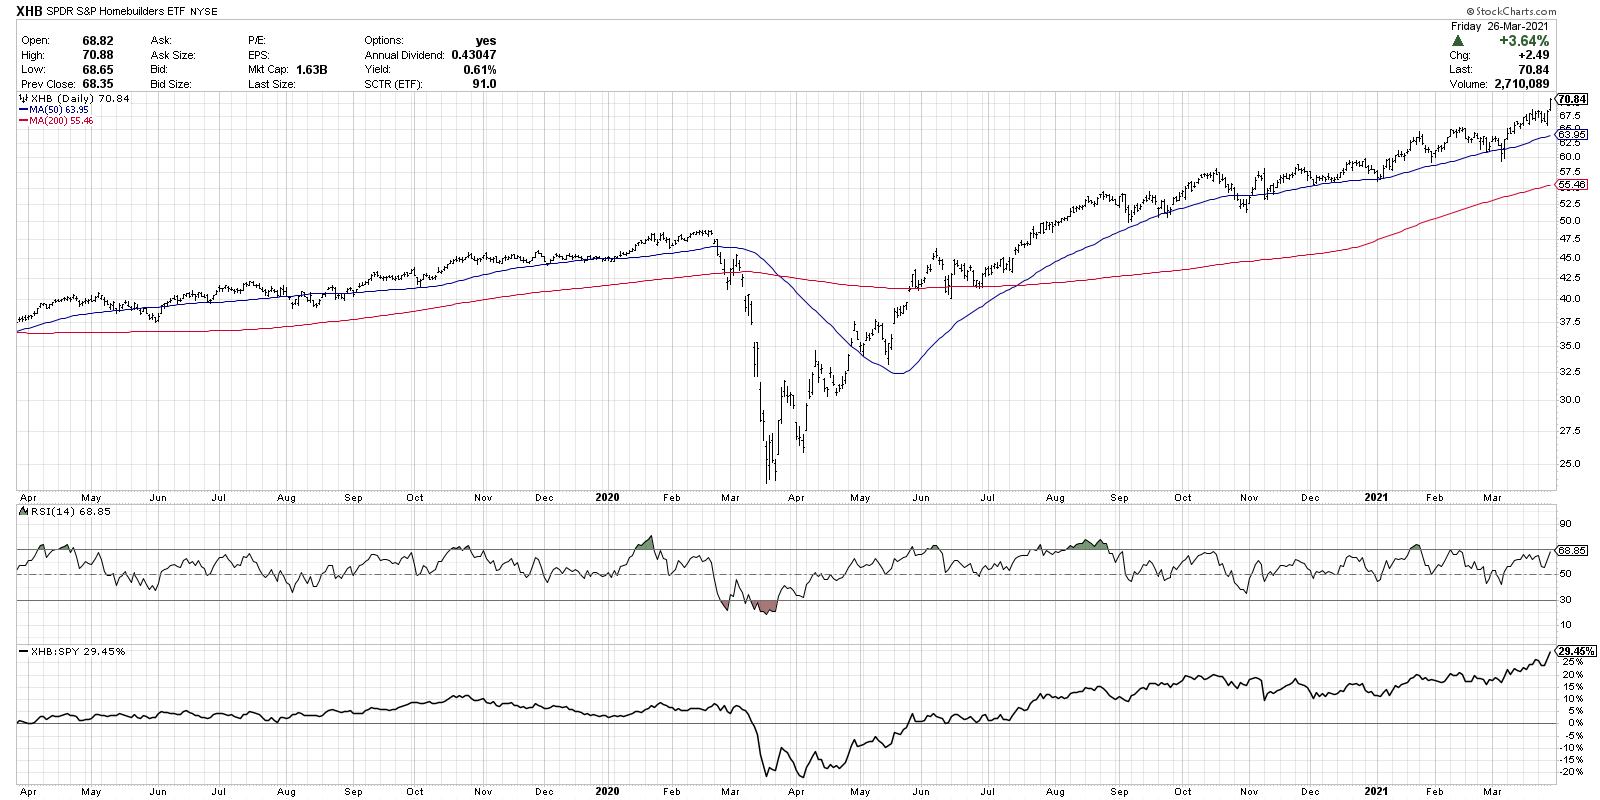
While LEN certainly seems to have an attractive technical setup here, many investors choose to gain exposure to this group using ETFs. There are two popular ETFs that have large exposure to homebuilders: the iShares US Home Construction ETF (ITB) and the S&P SPDR Homebuilders ETF (XHB).
It's worth noting that while both of these ETFs have almost doubled the return of the S&P 500 index for the last 12 months, there are subtle differences between the two. The ITB is comprised of about 60% homebuilding stocks, and the other 40% is made of home improvement stocks like Williams Sonoma (WSM), Sherwin Williams (SHW) and Home Depot (HD).

The XHB, on the other hand, is only 30% homebuilders, while the remaining 70% are other home improvement names. So in the case of XHB, the largest weight in the ETF is in WSM, which isn't a homebuilder!

The good news for these ETFs is that, regardless of their weightings in homebuilders versus other related groups, the price and relative strength profiles speak for themselves. They are in established uptrends of higher highs and higher lows. The relative strength has made new 52-week highs this week, as the stocks have pushed higher while stocks in other sectors have been pulling back or consolidating.
Want this article in video format? Just click the image above!
Technical analyst John Roque used to relate stock portfolios to baseball teams. If you were managing a baseball team and you were trying to defeat the New York Yankees (who wouldn't?), would you put your "pretty good" players on the field? Or would you put your top performers out there to provide your team with the best opportunity to win?
Why would you do any different with your portfolio?
RR#6,
Dave
P.S. Ready to upgrade your investment process? Check out my free course on behavioral investing!
David Keller, CMT
Chief Market Strategist
StockCharts.com
Disclaimer: This blog is for educational purposes only and should not be construed as financial advice. The ideas and strategies should never be used without first assessing your own personal and financial situation, or without consulting a financial professional.
The author does not have a position in mentioned securities at the time of publication. Any opinions expressed herein are solely those of the author, and do not in any way represent the views or opinions of any other person or entity.
