Last week, Friday 2/19, Tom Bowley invited me to be his guest in a webinar he did with EarningsBeats.com.
Of course, I talked about RRG in general and we applied it to international markets, crypto-currencies and US sectors. All good fun. After I presented my bit on sectors using the usual RRG for US sectors (SPDRs sectors family), Tom focused on small caps and he showed an RRG for small-cap sectors...
Wow!!! Call me ignorant, but I was not aware that that series of small cap sector ETFs existed. But when I saw it, it immediately set my creative mind off racing for ideas on how to use this setup and add it to the analytical mix.
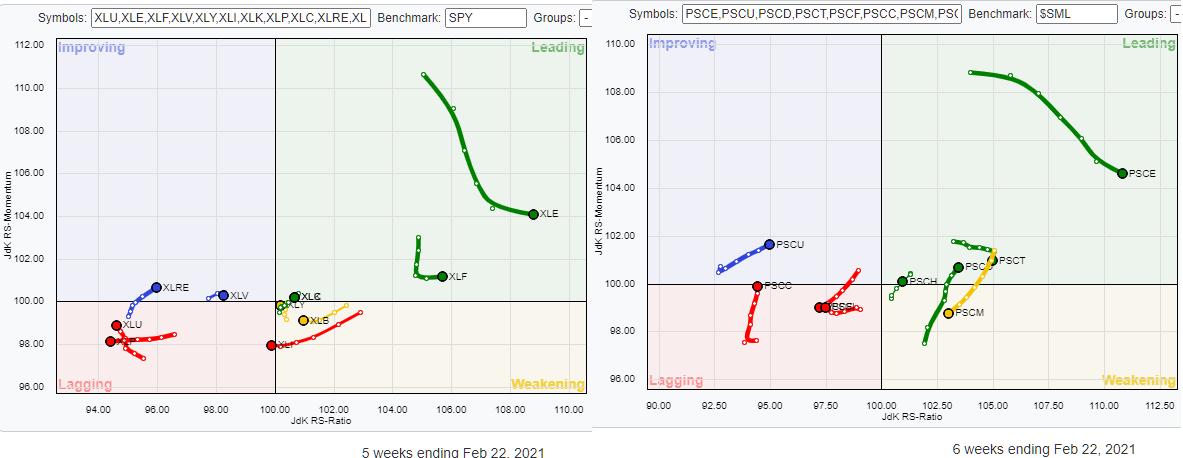
The image at the top of the article shows the RRG for the S&P 500 large-cap sectors at the left and small-cap sectors at the right. The only difference at a universe level is the fact that the small cap sectors do not have Communication Services in there; they are included in Technology. And Real-Estate is part of Financials. So the count for small-caps comes to 9 and large caps to 11, as we know.
This setup gives us a great opportunity to watch the rotations for the various sectors, large vs. small, side by side and see if their tails are following a similar path or if they are on a different track. The ones where the tails for the large cap and the small cap sectors are following a similar trajectory are less interesting. When these trajectories are diverging, that's when opportunities arise.
A good example of such an occurrence can be found for the Consumer Discretionary sector.

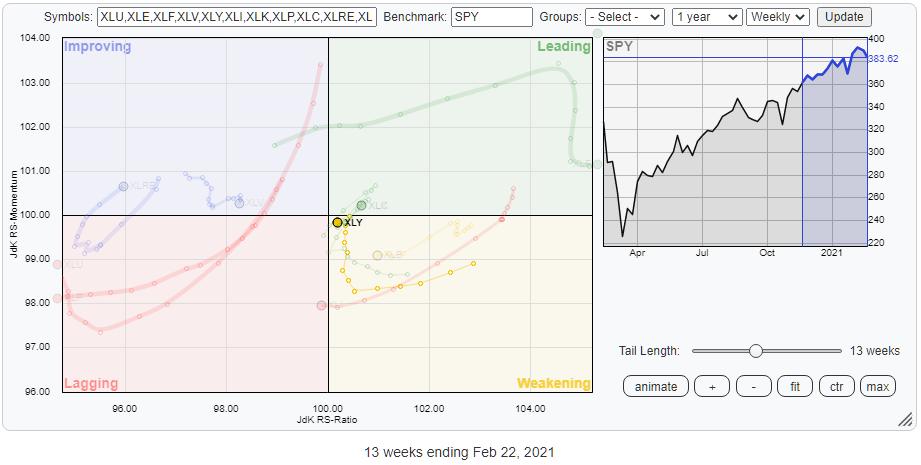
The tail for XLY is rotating through the weakening quadrant. Until a week ago, the sector was on its way back up to the leading quadrant, but last week the tail made a nasty move to the left towards the lagging quadrant. When TSLA and AMZN both have a bad week, the sector has a bad week.

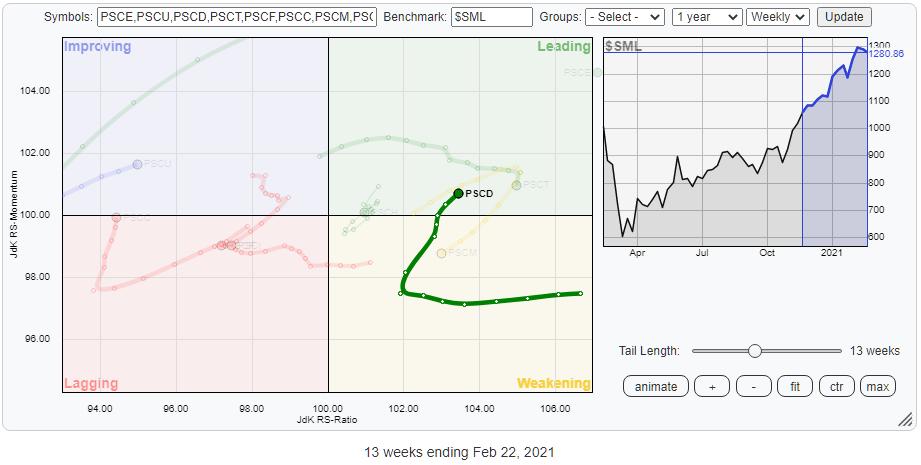
How different does the tail look on the RRG for small caps? The rotation through weakening has ended and PSCD is back inside the leading quadrant and moving higher on bot axes, pushing the sector further upward into positive territory. The different trajectories of these rotations indicate a clear preference for PSCD over XLY at the moment.
When you add this set of ETFs to your trading universe, it allows you to make the sector allocations in your portfolio even more precise by differentiating between large caps and small caps in the same sector.
There are more things to say about this combination of universes and I am planning to discuss that in next week's episode of Sector Spotlight. So make sure you tune in at 10:30am ET Tuesdays on StockCharts TV, or catch up with it on demand or on YouTube.
Y'all have a great weekend and #StaySafe, --Julius
My regular blog is the RRG Charts blog. If you would like to receive a notification when a new article is published there, simply "Subscribe" with your email address.
Julius de Kempenaer
Senior Technical Analyst, StockCharts.com
Creator, Relative Rotation Graphs
Founder, RRG Research
Host of: Sector Spotlight
Please find my handles for social media channels under the Bio below.
Feedback, comments or questions are welcome at Juliusdk@stockcharts.com. I cannot promise to respond to each and every message, but I will certainly read them and, where reasonably possible, use the feedback and comments or answer questions.
To discuss RRG with me on S.C.A.N., tag me using the handle Julius_RRG.
RRG, Relative Rotation Graphs, JdK RS-Ratio, and JdK RS-Momentum are registered trademarks of RRG Research.
