I always credit John Murphy for all of my work regarding intermarket relationships. He's inspired me in a number of ways and I continue to look for relationships that can better increase my odds of calling the stock market correctly. The great thing about these relationships is that we can chart them...... and backtest them! There are 2 intermarket relationships that are flashing major BUY signals for the S&P 500 right now - and I wouldn't ignore them.
Transportation vs. Utilities ($TRAN:$UTIL)
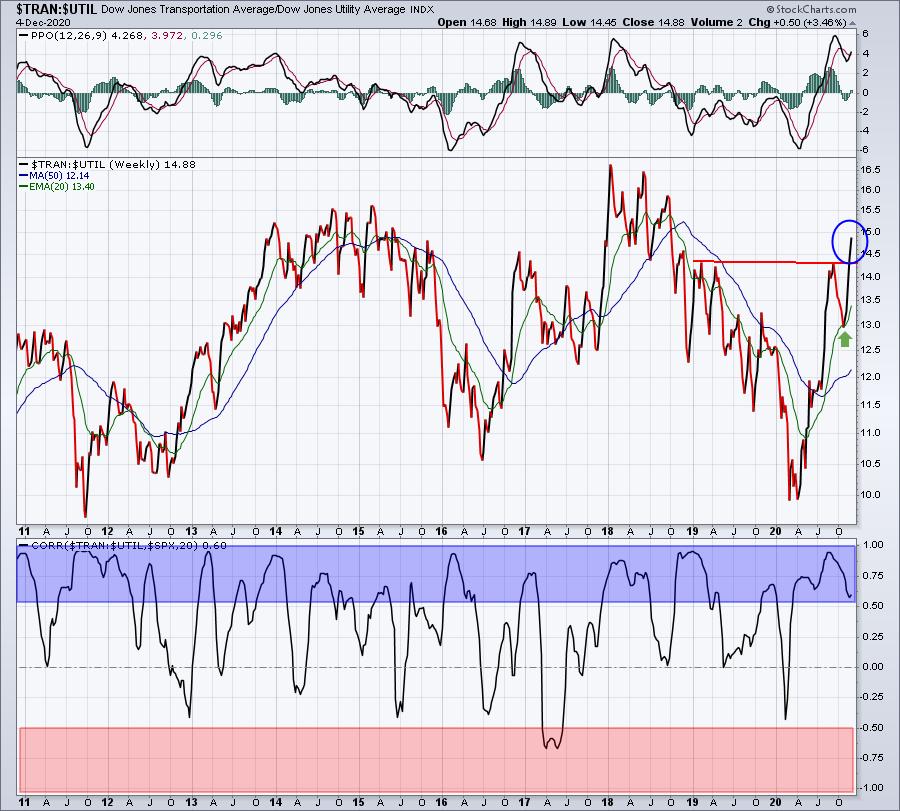
This one just makes perfect sense to me. The stock market looks ahead and, if transportation stocks are performing well, that sends a very powerful bullish signal. Meanwhile, utilities are defensive and perform better when the market is nervous or undecided. Check out the following breakout in this TRAN:UTIL ratio and then check out that bottom panel, which shows the correlation between this ratio and the performance of the S&P 500:

The blue-shaded area shows very strong positive correlation between the TRAN:UTIL ration and the S&P 500. The red-shaded area shows very strong negative correlation between the two. I think it's pretty clear that the S&P 500 tends to move in the same direction as the TRAN:UTIL ratio. Currently, this ratio is screaming higher, clearing a few tops in the 14.3 area.
Copper vs. Gold ($COPPER:$GOLD)
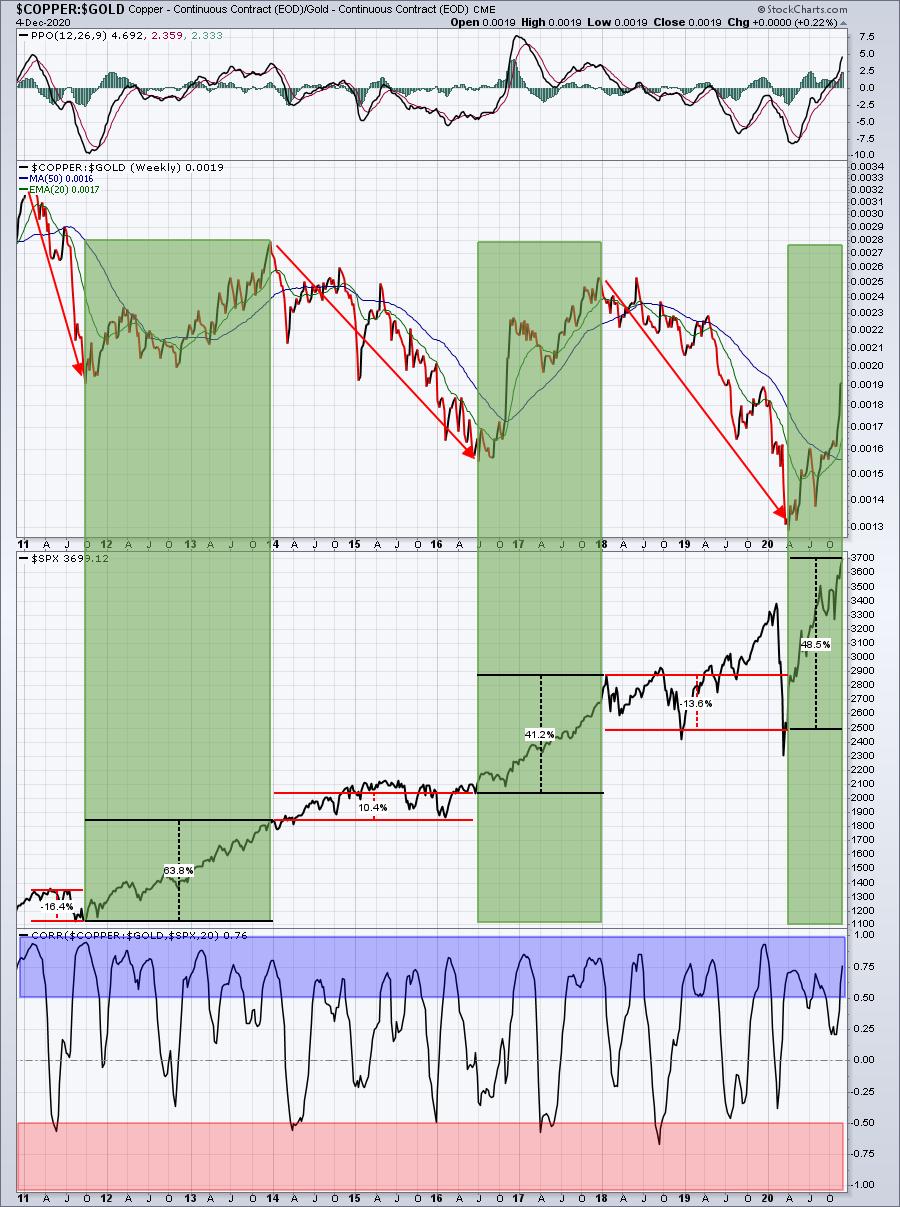
Copper is the commodity that's tied to global economic demand. Gold is mostly unrelated to economic performance; in fact, it has a history of performing well when the stock market is very unsettled and volatile. If you study history, you know that the biggest S&P 500 moves occur when the COPPER:GOLD ratio is flying higher. Check this out:

First, the bottom panel once again shows the powerful positive correlation between the COPPER:GOLD ratio and the direction of the S&P 500. It's unmistakeable.
The green-shaded areas above highlight the surging COPPER:GOLD ratio. During periods of relative strength for copper, the S&P 500 soars. The opposite is true when this ratio downtrends. It's very difficult for me to be bearish U.S. equities while the COPPER:GOLD ratio is flying to the upside.
Conclusion
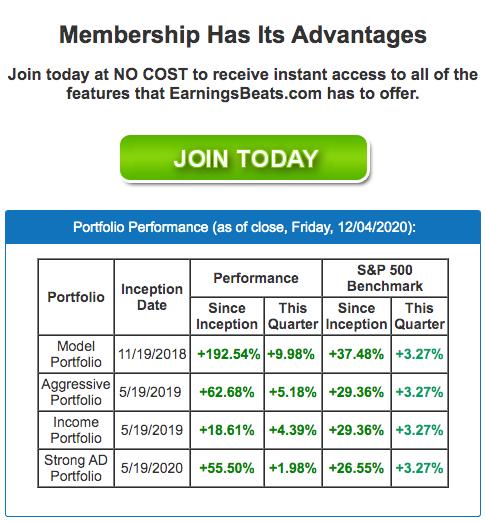
Based on these two relationships (and plenty of other bullish signals), we're remaining very aggressive on the long side. We will continue to focus on owning leading stocks in leading industry groups. Our portfolio results demonstrate that our approach is a winning approach. Here's a snapshot from our public home page at EarningsBeats.com, highlighting our performance:

Our Model Portfolio is now up 192.54% in just over 2 years. That's nearly a triple! It's a direct result of calling the market based on sound charting techniques and relationships, rather than listening to "click bait" media that called for The Great Depression 2.0 throughout 2020. It's also been the result of owning only stocks showing tremendous relative strength. CNBC shows us lips moving, nothing more. The charts here at StockCharts.com tell us what Wall Street is doing with their money. Which one do you want to follow, the lips or the charts?
I'd love to have you join our growing community at EarningsBeats.com. We have a free EB Digest newsletter that I publish 3x per week - on Monday, Wednesday and Friday mornings. There's no credit card required and you can unsubscribe at any time. CLICK HERE to enter your name and email address and join our community!
Happy trading!
Tom
