Major stock indexes continue to consolidate their November gains, and remain above recent support levels. Chart 1 shows the Dow Industrials pulling back over the last three days, but remaining above underlying support along their October peak and recent low near 29,000. Chart 2 shows the S&P 500 also pulling back, but remaining above last week's low just above 3500. Chart 3 shows the Nasdaq 100 QQQ Trust trading higher on Thursday, and remaining well above its moving average lines. It looks like the Nasdaq and the other two indexes are taking turns showing short-term leadership. A rebound in communications and technology stocks is supporting Thursday's Nasdaq gains; while utilities and healthcare are weighing on the Dow and S&P 500.
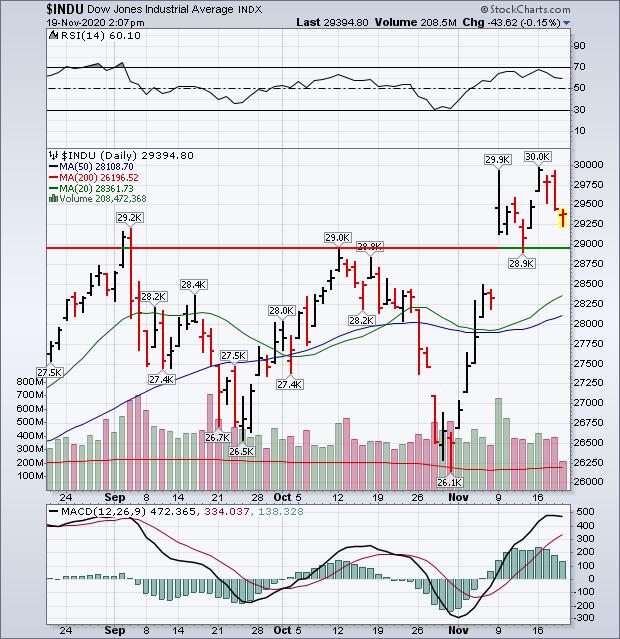 Chart 1
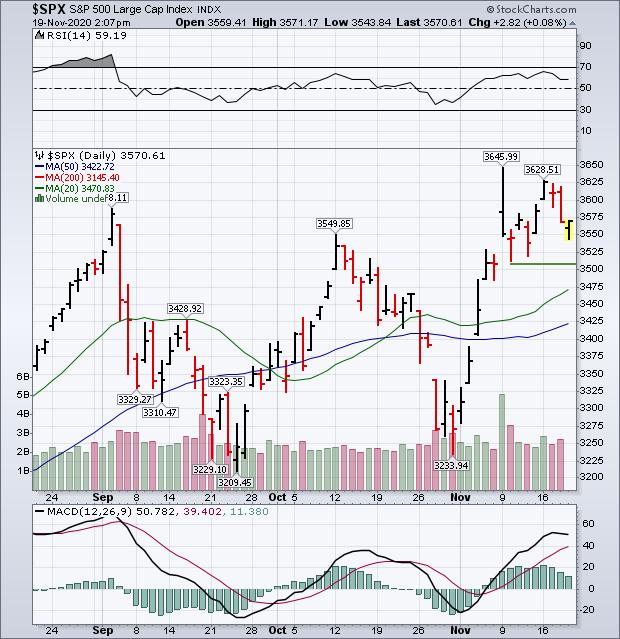 Chart 2
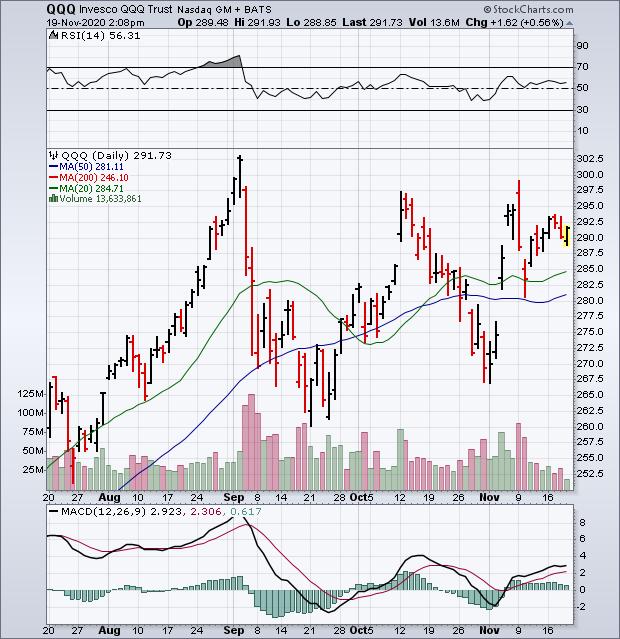 Chart 3
Although energy has been the market's weakest sector this year, it has been the past month's strongest sector. A lot of that has to do with a rebound in energy prices. The daily bars in Chart 4 reflect the November rebound in the Energy SPDR (XLE) and shows it trying to clear its 200-day moving average. That's the first important test for the sector. The XLE, however, still remains below previous peaks formed in June and August and has ways to go to turn its major trend higher. It will need a much stronger oil market to accomplish that. Chart 5 shows the United States Oil Fund (USO) running into some selling near the highs of the past two months. That's an important test of the USO uptrend and could have an impact on the direction of the XLE.
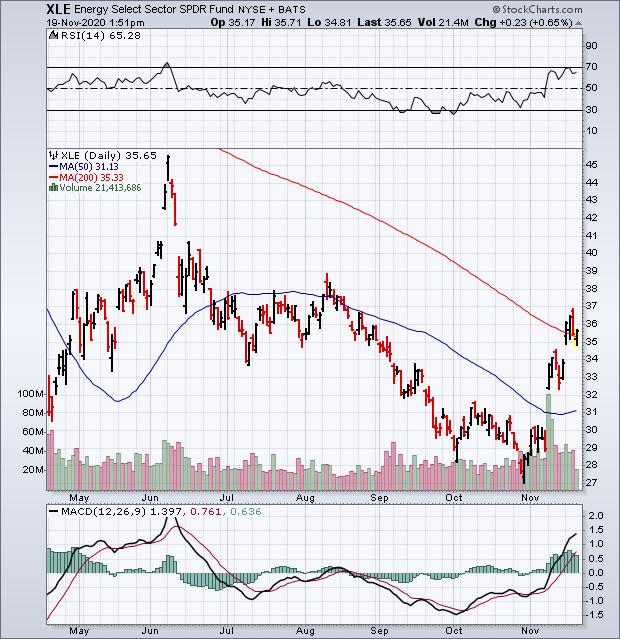 Chart 4
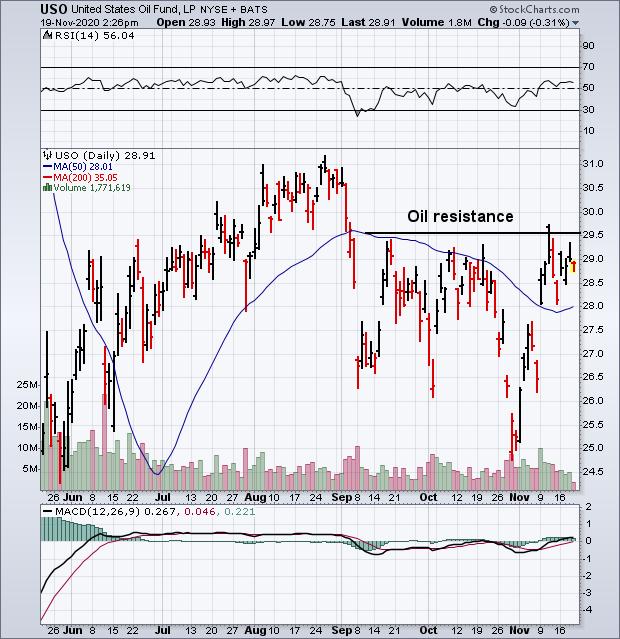 Chart 5
Editor's Note: This is an article that was originally published in John Murphy's Market Message on Thursday, November 19th at 2:09pm ET.
