Despite gaining ground this past week, little has changed for the market's major stock indexes. Continued buying of technology growth stocks pushed the Nasdaq Composite to a new record (Chart 1). The rest of the market, however, continued to lag behind. Chart 2 shows the S&P 500 moving up to test initial overhead resistance at 3155 Thursday morning before weakening a bit going into the close. The SPX needs to clear that barrier to improve its short-term trend. Little has changed for the Dow as well. Chart 3 shows the Dow Industrials backing off late Thursday from its 200-day moving average. Stocks opened sharply higher on Thursday following a strong jobs report for June. Some profit-taking late in the day, however, cut those earlier gains and kept the Dow and SPX stocks in their current trading range. Other parts of the market saw little change as well. Weaker airline stocks undercut a rally attempt in transportation stocks; and kept the Dow Transports below their 200-day average. The Russell 2000 Small Cap Index also remains below its red resistance line. The inability of those two groups to gain ground acts as a headwind for the broader market. So does continued weakness in financials.
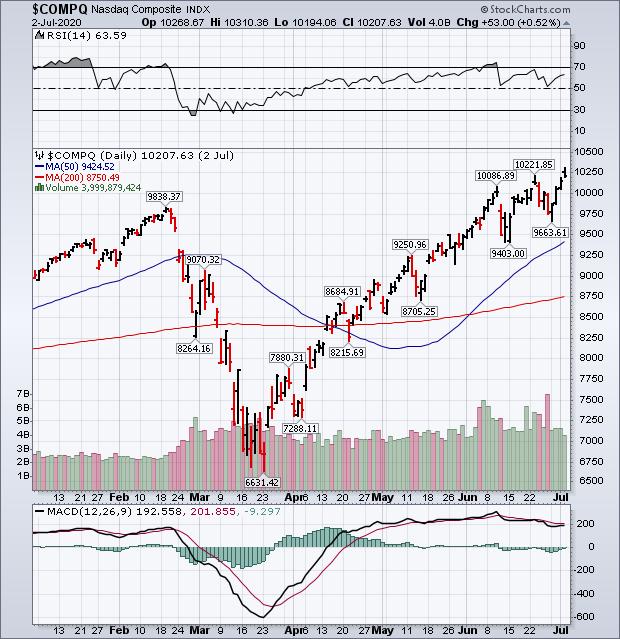 Chart 1
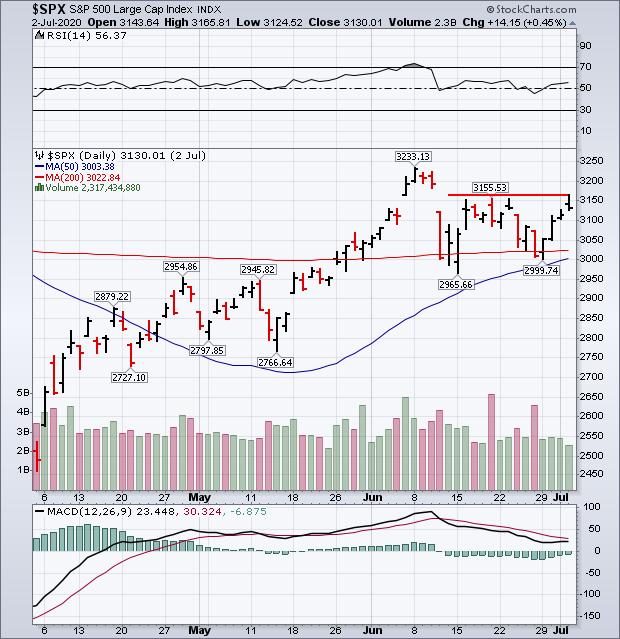 Chart 2
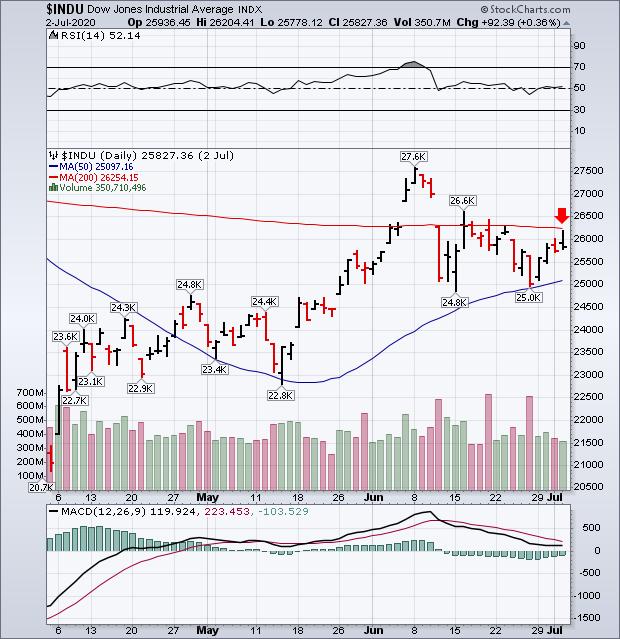 Chart 3
Chart 4 shows the Dow Transports ending the week higher, but remaining below their 200-day moving average, and initial chart resistance at 9500. A big jump in Fedex and UPS at midweek accounted for most of their gains. Truckers and rails also gained some ground. Airline stocks, however, continue to hold the transports backs. The red bars in Chart 4 show the relative weakness in airlines. And largely explains why transports as a group continue to underperform the rest of the market. That's disappointing for those of us who use the transports as an indicator on the health of the U.S. economy.
Smaller stocks continue to lag behind large caps. Chart 5 shows the Russell 2000 iShares (IWM) backing off from its 200-day line on Thursday. The inability of small and midcap stock indexes to clear their 200-day lines also detracts from the breadth of the market. And may make it more difficult for larger cap stock indexes to make much headway on the upside. Weak financial stocks are another negative feature.
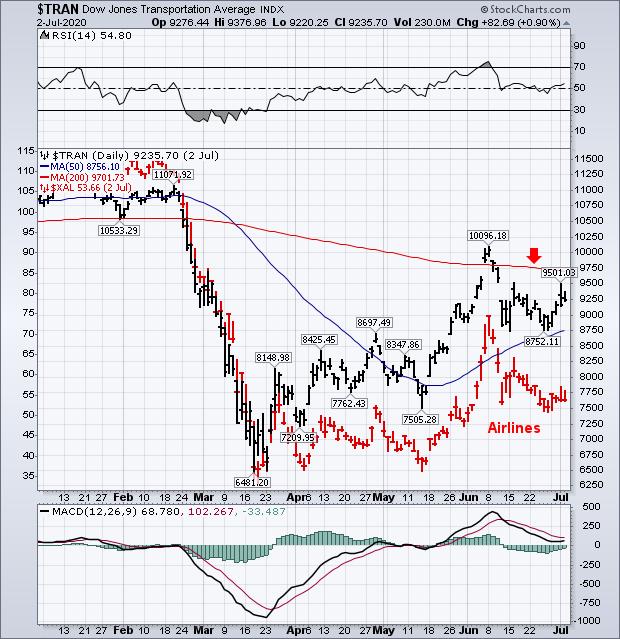 Chart 4
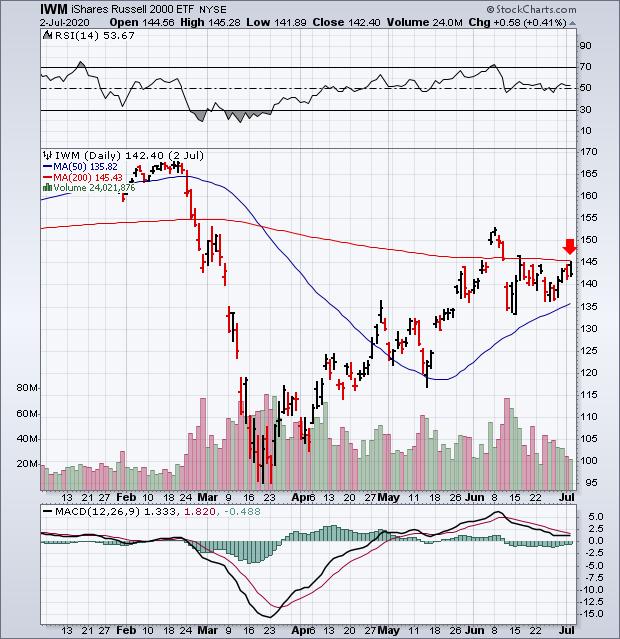 Chart 5
Financial stocks were week's biggest losers. And banks were the main reason why. The daily bars in Chart 6 show the KBW Bank Index ending the week below its 50-day average. Its loss of -5.4% for the week helped pull the entire sector lower. The falling solid line is a ratio of the Financial SPDR (XLF) versus the S&P 500 and has fallen to the lowest level since early May. And shows how much the financials are lagging behind the rest of the market. Historically low Treasury yields are holding the financial sector back. After climbing yesterday morning following the strong June jobs report, Treasury yields ended the day lower. And may account for Thursday's weak bank closing. That weakness in financial stocks is another drag on the broader market.
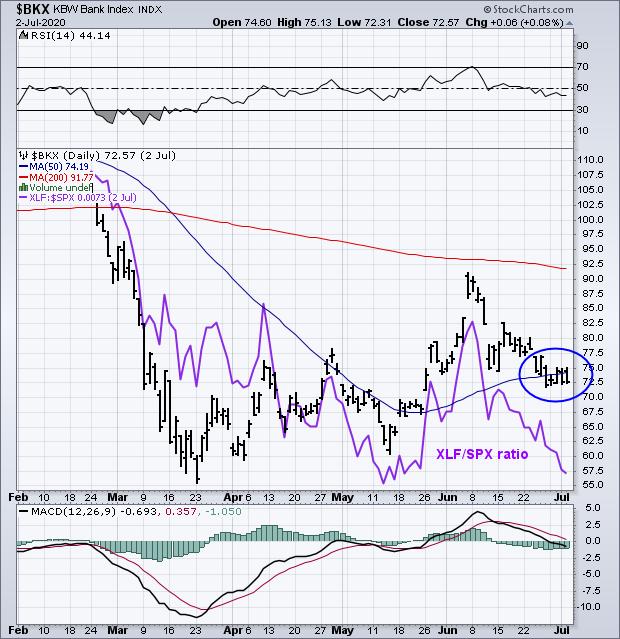 Chart 6
One of the difficulties in analyzing the stock market is that there appear to be two markets. That can be seen in Chart 7 which ranks the eleven market sectors year-to-date by their percentage gains (last column). Technology is the clear winner and the only sector to hit a new record (led by tech growth stocks like Apple and Microsoft). Other gainers include Consumer Discretionary (led by Amazon.com); and Communication Services (led higher by Alphabet, Facebook, and Netflix). The covid pandemic has also given a boost to healthcare stocks. The other seven sectors have not only lost ground, but have lagged behind the S&P 500 (which is down -3.1% since the start of the year). Energy, Financials, and Industrials have been the year's biggest losers.
Chart 8 shows the seven market sectors underperforming the S&P 500 (plotted as the zero line) year-to-date; and the four market sectors on the left doing better (above the S&P 500 zero line). It remains to be seen how long that narrow group of sector winners can carry the rest of the market with them.
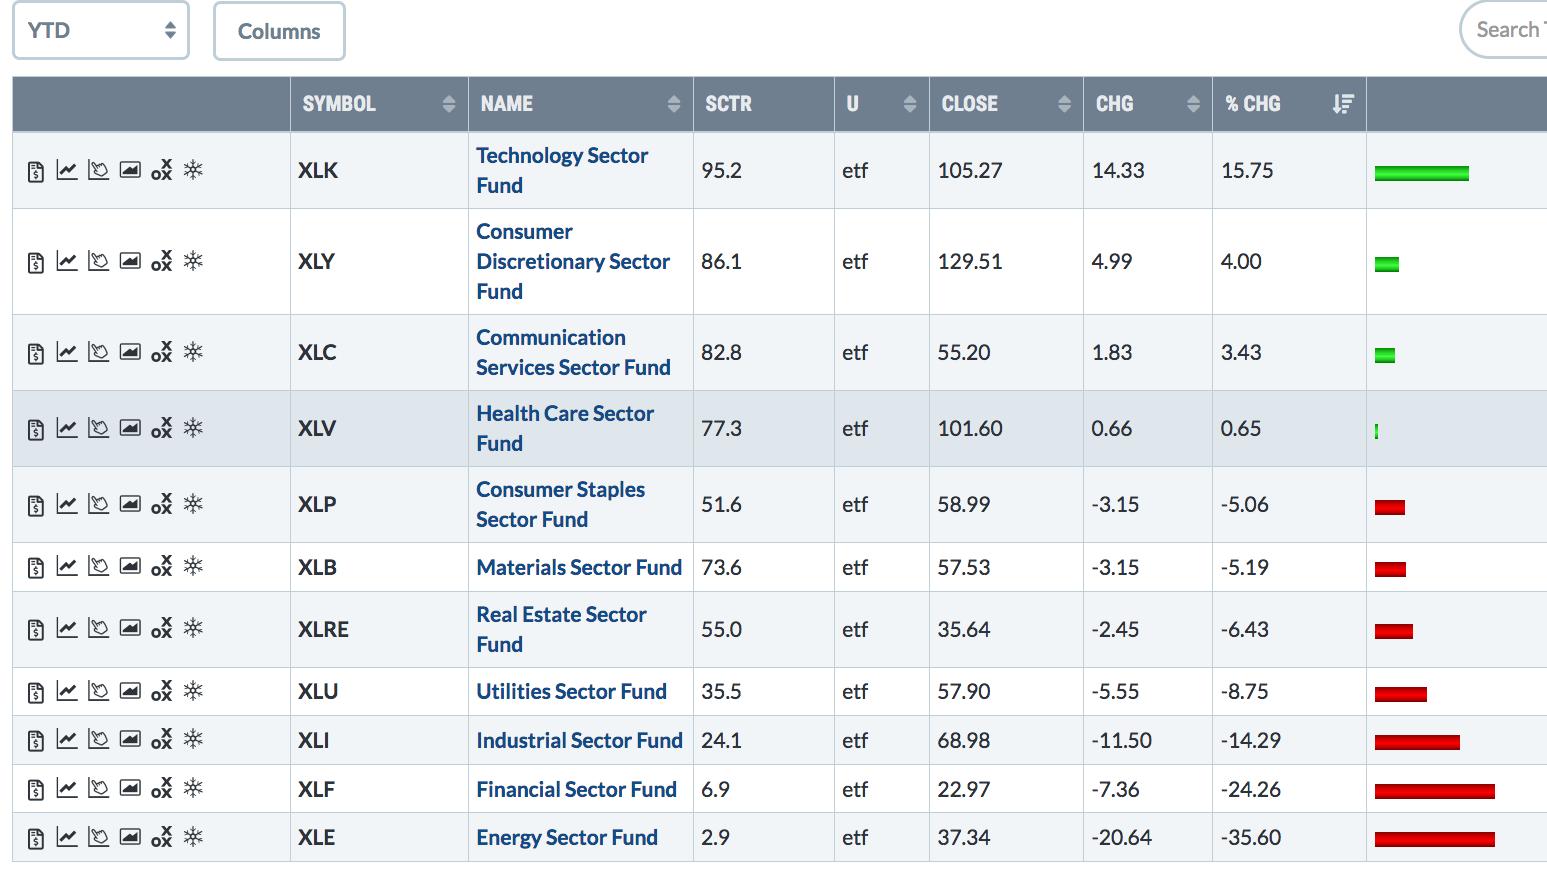 Chart 7
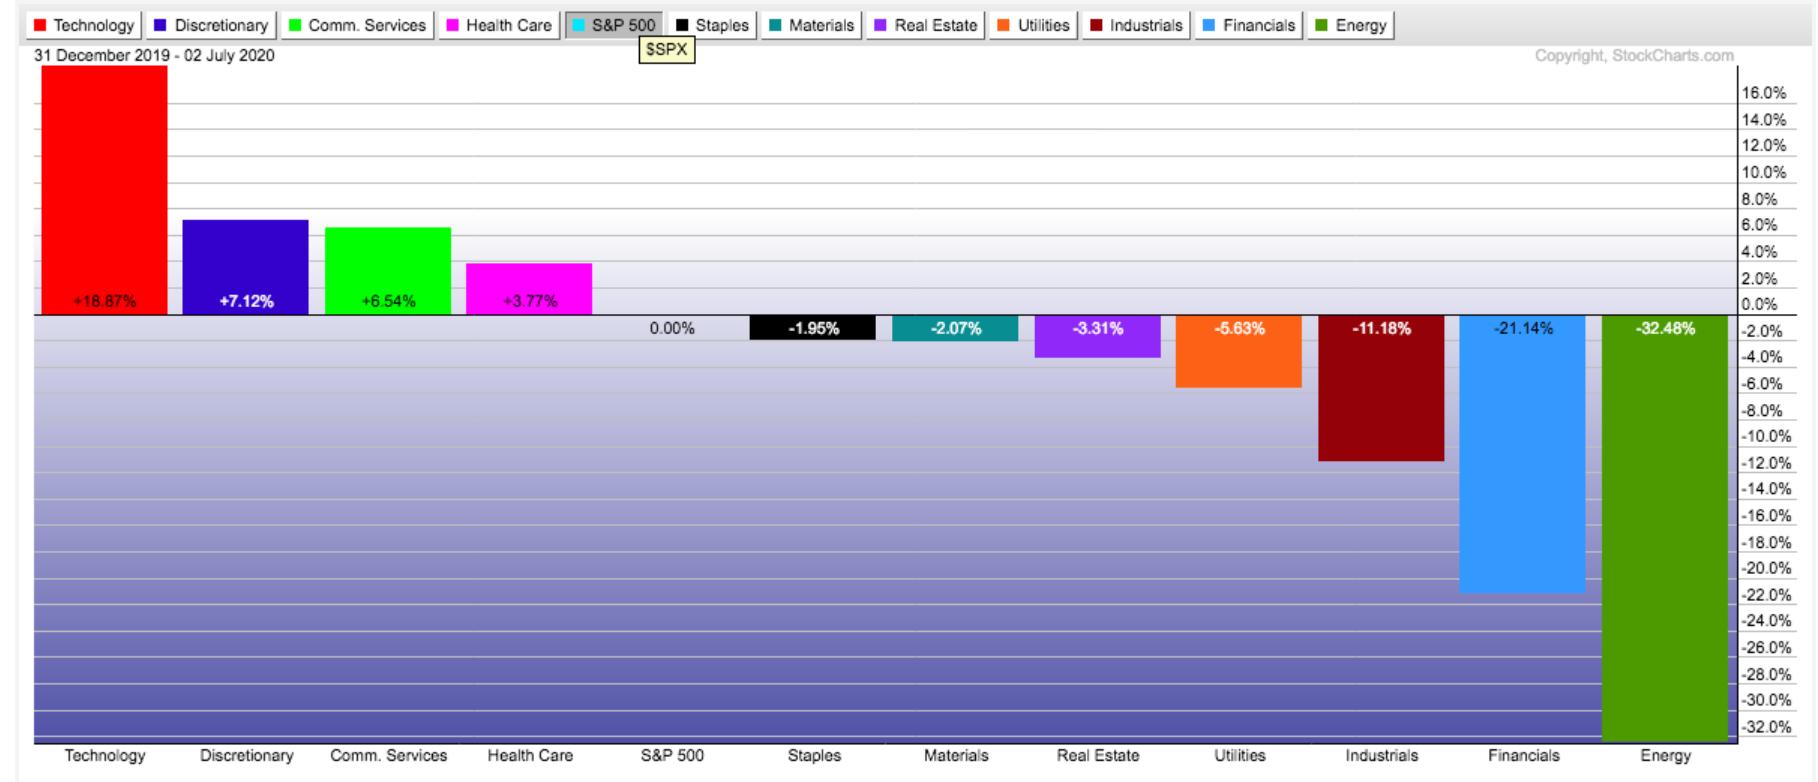 Chart 8
Editor's Note: This is an article that was originally published in John Murphy's Market Message on Friday, July 3rd at 12:27pm ET.
