One of the ways I like to measure offensive vs. defensive pressure in the equity market is using the ratio of Consumer Discretionary to Consumer Staples. Watching this ratio can tell you whether institutions are betting more on the "offense," like retail and travel names, or the traditional "defense," like beverages, tobacco and personal products.
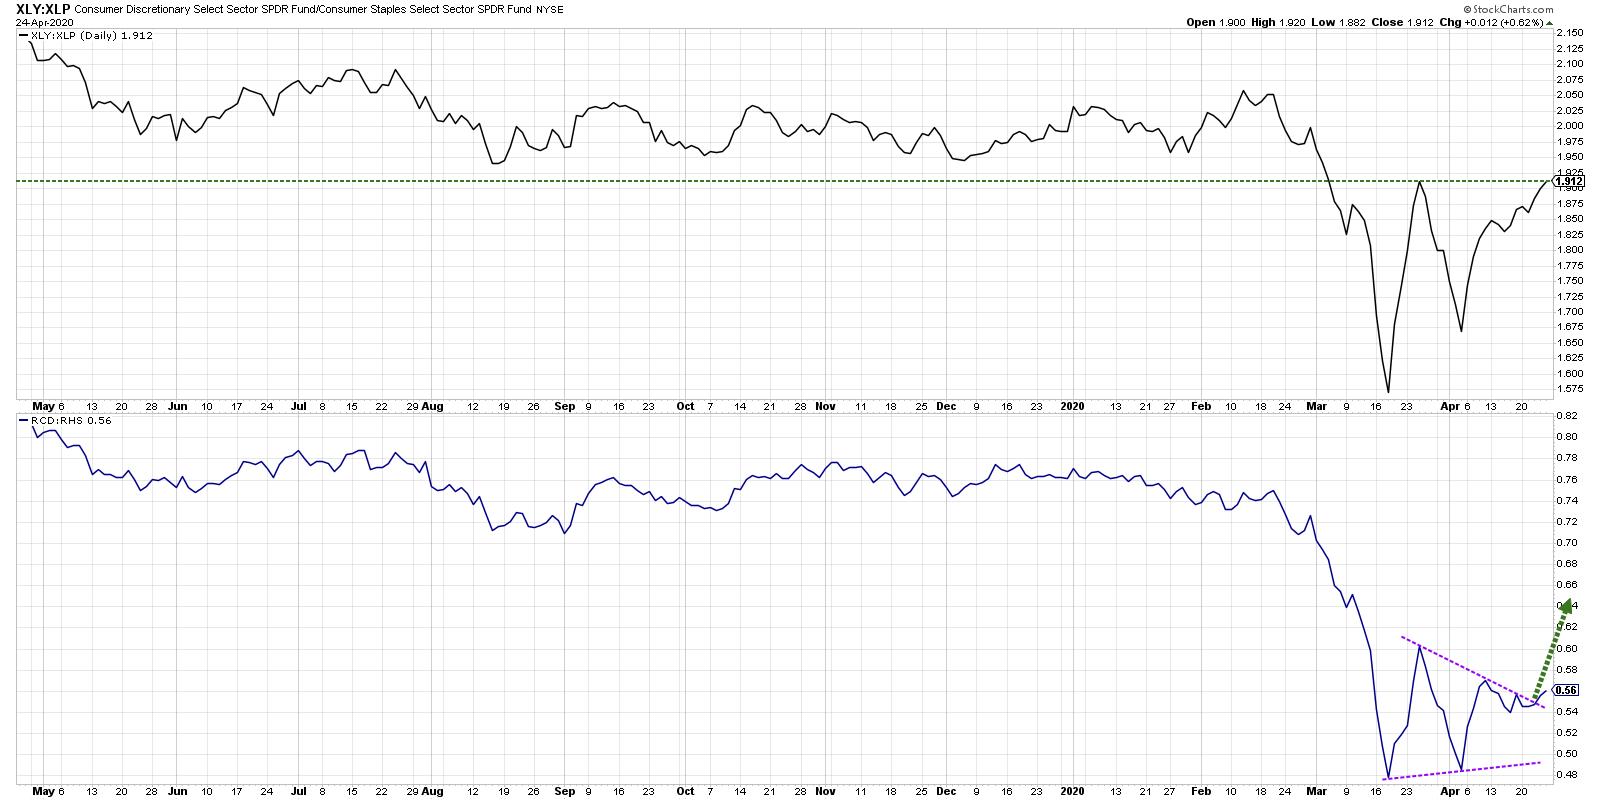
While these ratios have essentially remained in a holding pattern since the market bottom in March, both the cap-weighted and equal-weighted ratios are now threatening a breakout to the upside. A confirmed breakout would suggest more institutions betting on the offense and would further support a short-term bullish outlook.

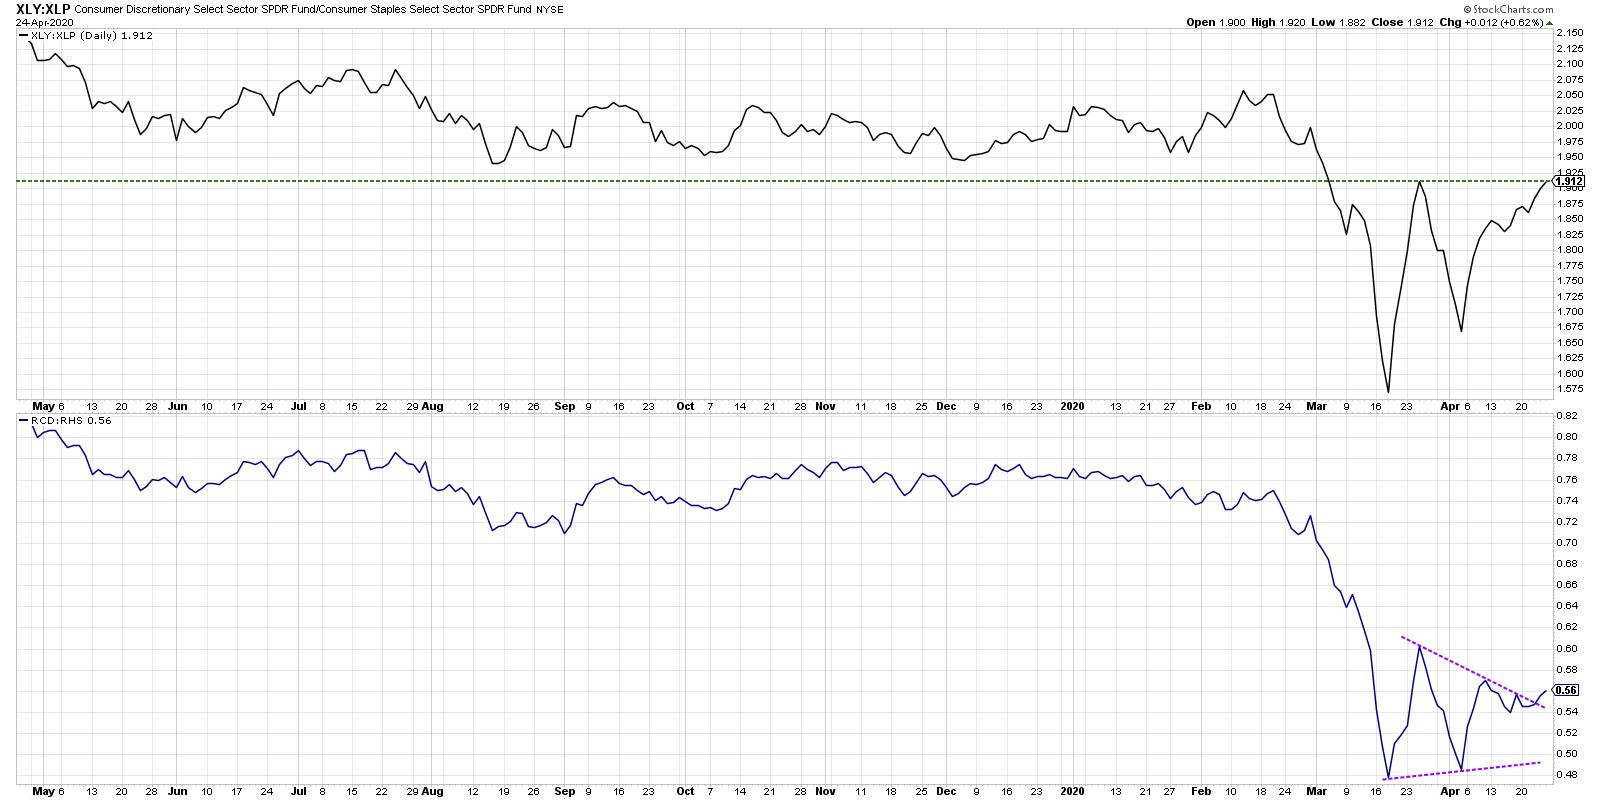
This chart includes the cap-weighted (XLY vs. XLP), along with a ratio using the equal-weighted ETFs (RCD vs. RHS). Due to AMZN's huge overweight in the XLY, the equal-weighted version will reduce the "Amazon effect" and give a better read on how the overall sectors are performing relative to one another.
Both of the ratios broke down in mid-February, although it is noteworthy that the equal-weighted ratio put in a lower high in February while the cap-weighted version went to new highs.
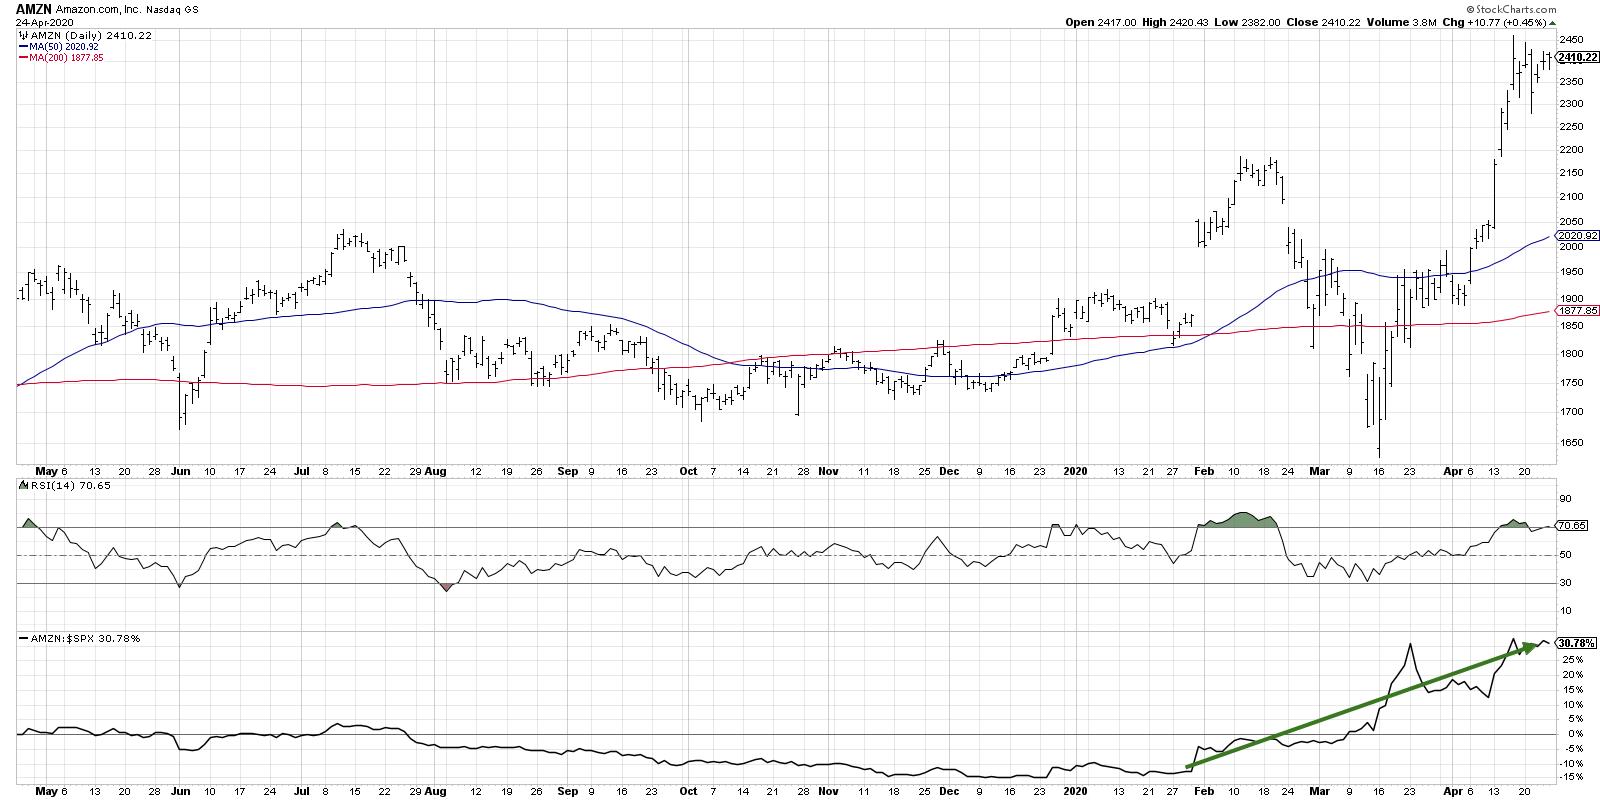
Since the market bottom in mid-March, the XLY spiked up relative to the XLP based on AMZN's resilience through the bear market phase. See the relative strength and how AMZN has outperformed, both during the way down as well as during the market recovery over the last four weeks.

The cap-weighted ratio is now testing the resistance level set in late March after the initial market rebound. If the XLY continues higher relative to the XLP, taking the ratio above that late March peak, it would suggest further upside for stocks.
The equal-weighted ratio gives an even clearer picture of the relative performance, as, again, it minimizes the overweight of AMZN in the calculation.

With that ratio breaking higher, this suggests that it's not just Amazon that is driving the chart. This breakout proposes that the average Consumer Discretionary stock is outperforming the average Consumer Staples name. To put another way, investors are betting more on offense than defense.
To be clear, both of these ratios can go higher while the broad market goes lower. There have been times when the overall market has rallied and defensive sectors like Consumer Staples or Utilities have been top performers. There have also been market downtrends where traditional offense like Technology has done very well.
I remain bearish on the broader equity market and have to assume that we're in the later stages of a bear market rally here. Sector ratios can help illustrate how investors are positioning around this overall market bias, as well as how that relates to the overall picture using breadth, momentum and sentiment readings.
I'm looking for any indications on what institutions are doing with their sector allocations. And, if these ratios continue higher, it means investors are betting on further upside.
RR#6,
Dave
David Keller, CMT
Chief Market Strategist
StockCharts.com
Disclaimer: This blog is for educational purposes only and should not be construed as financial advice. The ideas and strategies should never be used without first assessing your own personal and financial situation or without consulting a financial professional.
The author does not have a position in mentioned securities at the time of publication. Any opinions expressed herein are solely those of the author and do not in any way represent the views or opinions of any other person or entity.
