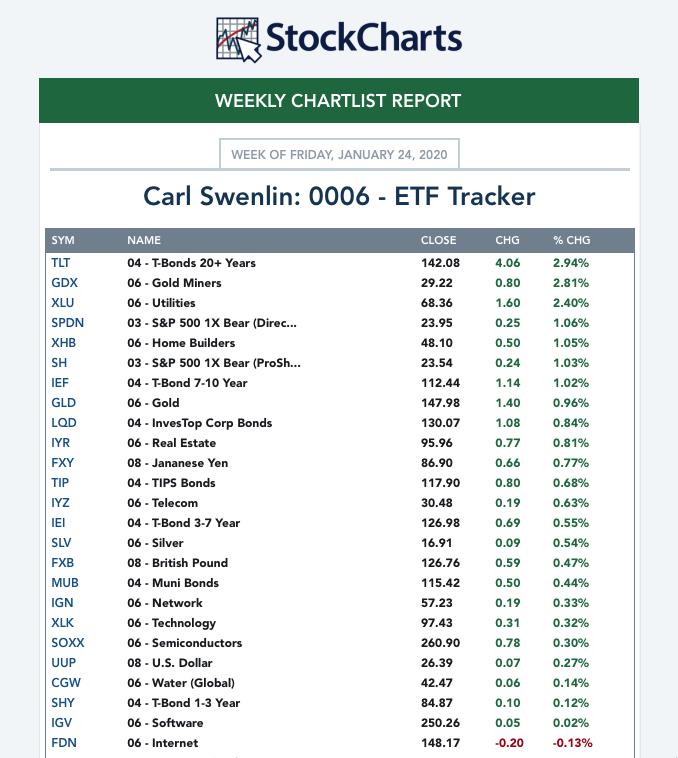
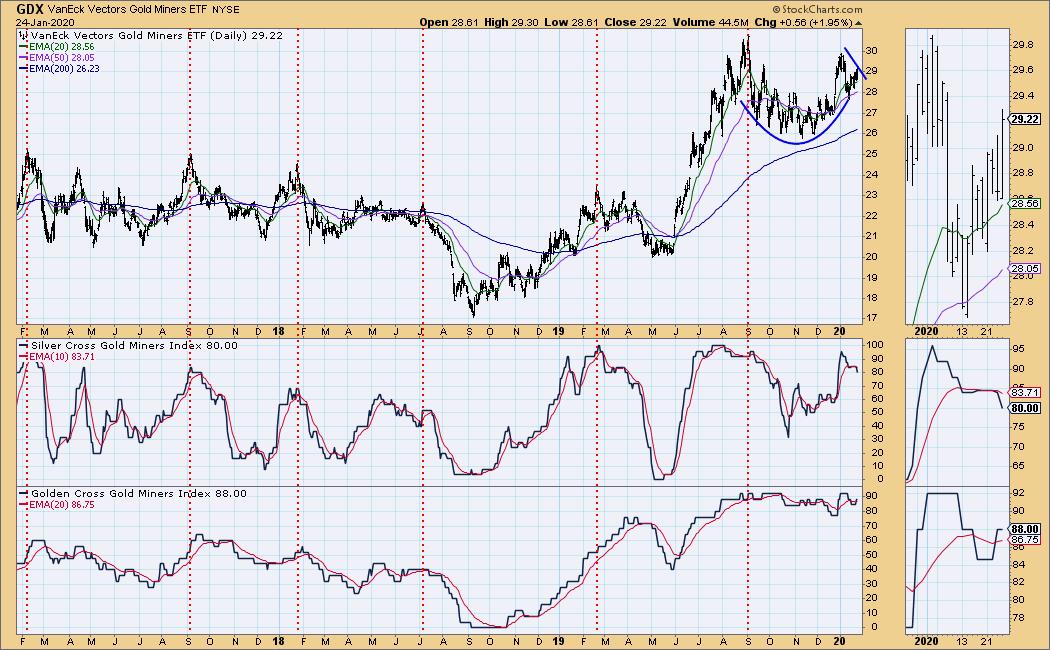
Gold Miners have been on fire this week! Each Friday, I get a Weekly ChartList Report on the ETF Tracker ChartList that Carl and I have developed. If you would like it, you'll find it in the DP Trend and Condition ChartPack (free to Extra members and above!). Nearly every day, I have seen Gold Miners near the top, so it wasn't surprising to see it at the top on the Weekly Report. DecisionPoint has developed a "Golden Cross Index" (GCI) and "Silver Cross Index" (SCI) which tell us how many stocks in those indexes or groups have 50-EMAs above their 200-EMAs (GCI) and how many have 20-EMAs above their 50-EMAs. We have the GCI and SCI for Gold Miners, so I thought I'd share some extra insight.


As investors, we want to accomplish two basic things: (1) determine the trend and condition of the market, and (2) select stocks that will ride that tide. The DecisionPoint Alert helps with the first step; DecisionPoint Diamonds helps with the second. Go to DecisionPoint.com and SUBSCRIBE TODAY! (Charter Subscriber Discounts Available!)
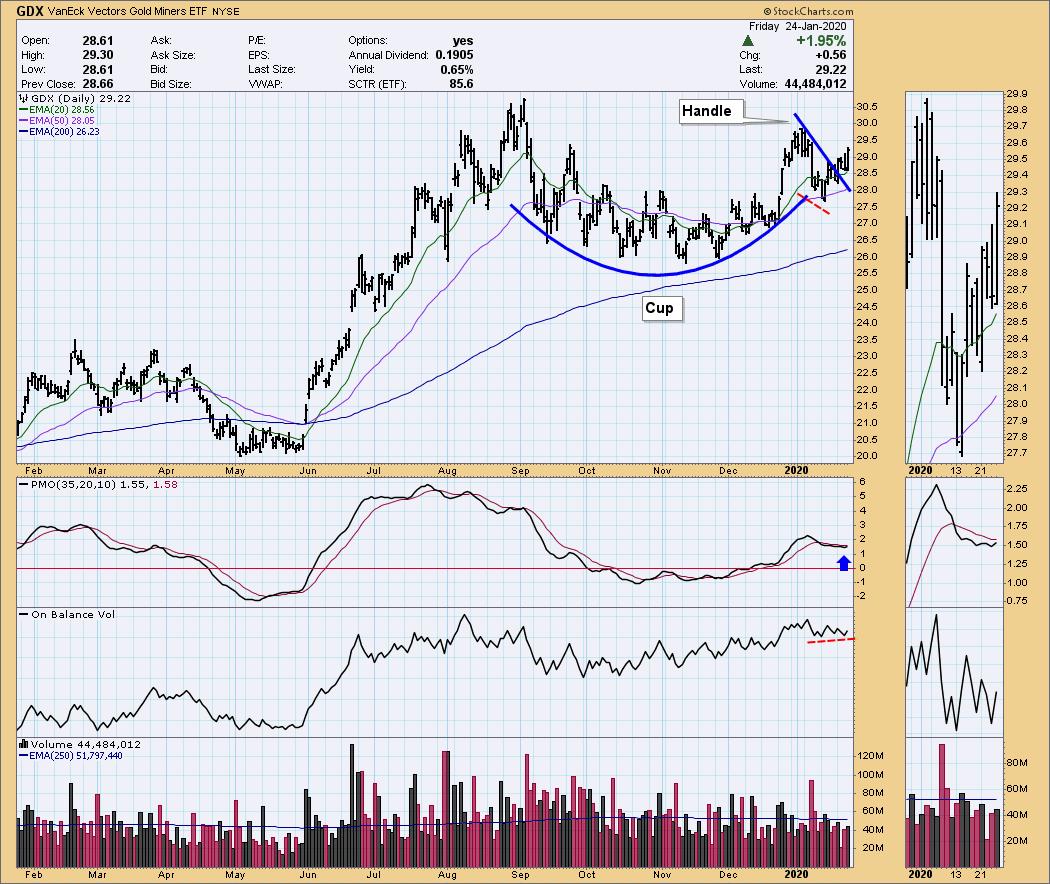
Below is the daily chart for GDX, the Gold Miners ETF that we track. The chart shows a textbook "cup and handle" chart pattern. It began to execute this week, with the breakout from the declining tops trend line that is the "handle" of the pattern. The PMO is confirming this breakout as it rises to likely give us a crossover BUY signal. Another plus on the daily chart is the positive divergence between OBV rising bottoms and declining price lows.

We are seeing a pullback on the Silver Cross Index, as well as a drop below the signal line. I find this healthy and appropriate right now, given how overbought this group was. It still is at a healthy reading of 80, meaning 80% of the Gold Miners in this ETF have 20-EMAs above 50-EMAs. Now, as price breaks out from the handle, we do want to see the SCI begin to turn back up to confirm; it isn't right now, which could be a problem if this rally is to be sustained. On the other hand, the Golden Cross Index looks great, albeit overbought. It is rising and, as you can see, since the end of summer it has maintained mostly above 80. Overbought conditions can persist in a bull market rally.

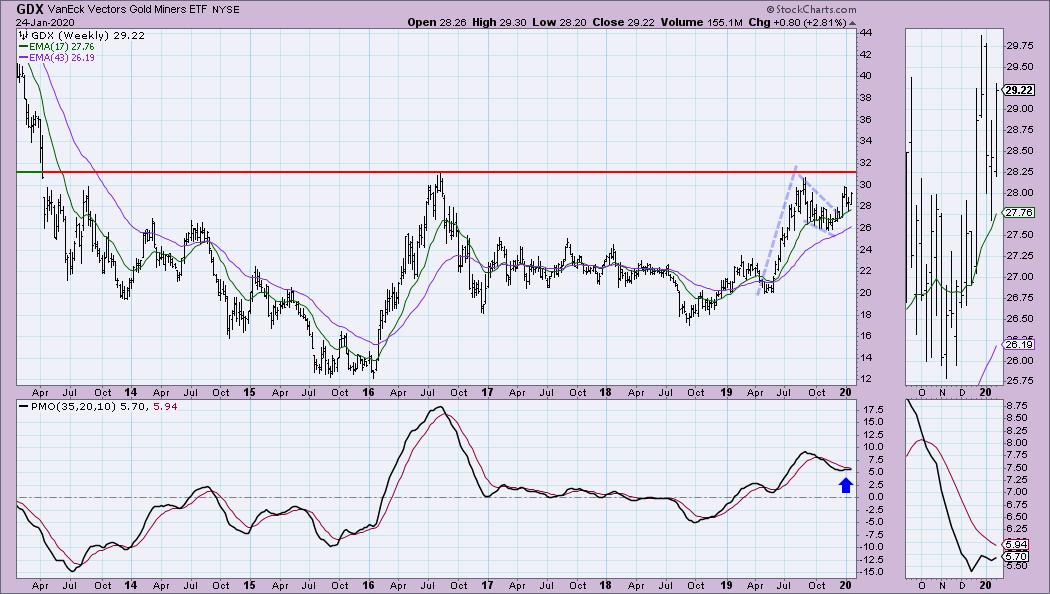
Below is a weekly chart of GDX. Here it looks as though a flag has executed. The big area of overhead resistance lies close, at $31. The weekly PMO has turned up after this week's rally.

Conclusion: Overall, I'd say Gold Miners have the potential to continue higher. The Silver Cross Index is pulling back and overhead resistance is pretty close, but the daily and weekly PMO are confirming and not overbought, the chart pattern is very bullish and I like the positive divergence of the OBV on the daily chart. If you haven't checked out our new website DecisionPoint.com, I invite you to come see it and sign up for our free email newsletter!
Technical Analysis is a windsock, not a crystal ball.
Happy Charting! - Erin
Email: erin@decisionpoint.com

Erin Swenlin will be presenting at the The MoneyShow Las Vegas May 11-13, 2020! You'll have an opportunity to meet Erin and discuss the latest DecisionPoint news and Diamond Scans. The conference is free to attend or view online!
Helpful DecisionPoint Links (Can Be Found on DecisionPoint.com Links Page):
DecisionPoint Shared ChartList and DecisionPoint Chart Gallery
Price Momentum Oscillator (PMO)
Swenlin Trading Oscillators (STO-B and STO-V)
