 We are seeing breakouts and new highs galore in the stock market. Does this sound the all clear? Hardly. Investors waiting for the all clear will probably be waiting a long time. Moreover, the "all clear" could even mark the top, because that's just the way Mr. Market operates.
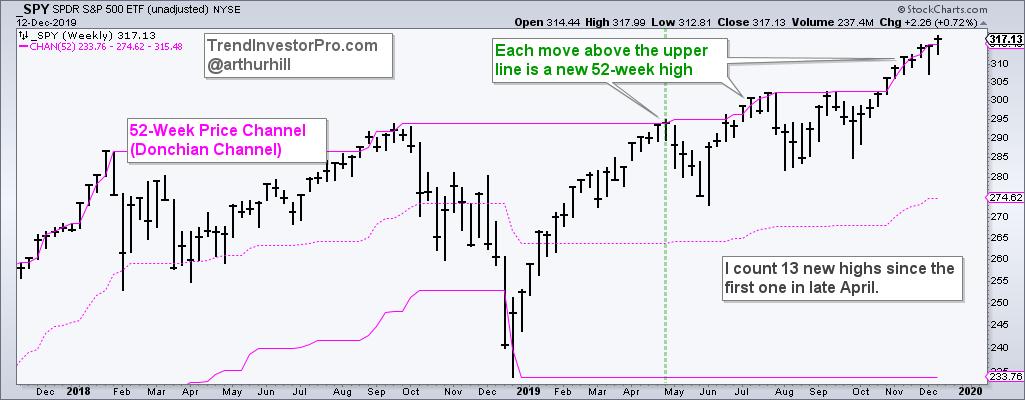
Note that the new high in the S&P 500 SPDR is not a "new" new high and this uptrend is hardly new. The chart below shows unadjusted SPY (_SPY) with 52-week Price Channels, also known as Donchian Channels, which were used by the famous Turtle Traders. A price bar that exceeds the upper channel line indicates a new 52-week high.

As the chart above shows, SPY recorded its first 52-week high of the year in late April, and then recorded another dozen new highs. The trend was clearly up with the initial 52-week high and this uptrend proved to be the dominant force at work. Even though SPY pulled back the next four weeks, it quickly recovered and recorded more new highs over the next six months.
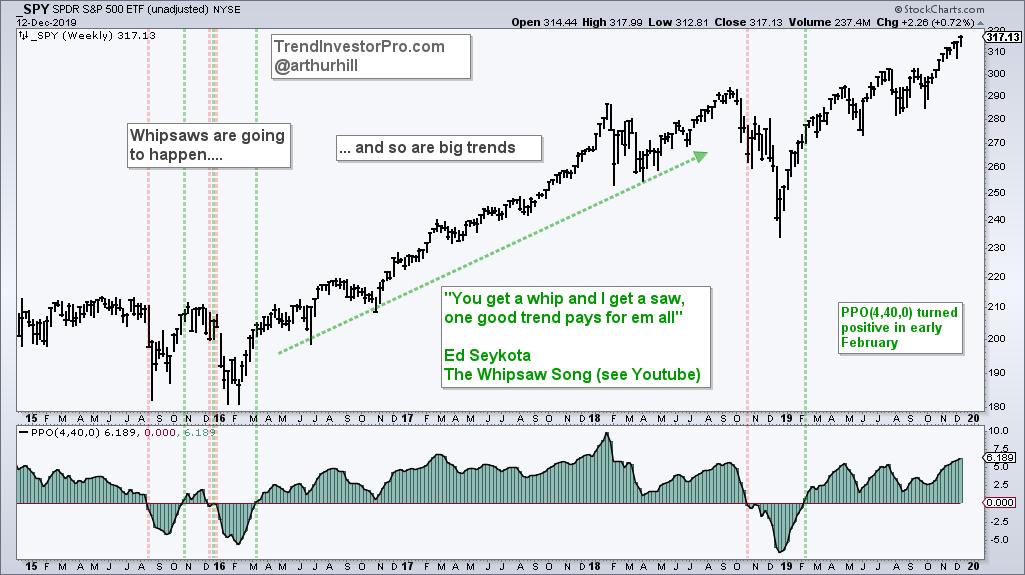
The next chart shows SPY with the weekly PPO(4,40,0) over the last five years. This is a trend indicator because it turns positive when the 4-week EMA moves above the 40-week EMA. This EMA pair is comparable to the 20-200 day moving average pair. As expected with trend following indicators, the PPO has its fair share of whipsaws, but it also catches some nice trends that more than pay for these whipsaws.

The left side of the chart shows whipsaws from August to December 2015. The PPO then turned positive in March 2016 and this foreshadowed a massive advance into October 2018. This exceedingly simple indicator would have gotten one out ahead of last December's meltdown and back in for the bull run over the last ten months.
As with trend following in general, the PPO is not perfect, but it ain't half bad. Whipsaws are unavoidable and part of the investing process. We must learn to live with the whipsaws to catch the big trends. Want to learn more about trend following? Subscribe to TrendInvestorPro.com or see below...
---------------------------------------------------------------------------------------------------------------------------

Note that I will be speaking at MarketVision 2020 on January 4th and the presentation is entitled:
The Method and the Madness behind Trend Following
I will start by discussing the nature of trend following and setting realistic expectations. I will then explain some key trend indicators and signals, and test these over a twenty year period. And last, but not least, I will show how some basic market timing can greatly reduce drawdowns and improve risk-adjusted returns.
John Murphy and another seven of your favorite analysts from StockCharts will also be speaking at this online event. Pre-registration is free and has its benefits. First, you get access to the mini-series webinars and recordings from each presenter. These webinars run from late November to late December. Second, you get a discount with special access to early bird pricing (click here).

---------------------------------------------------------------------------------------------------------------------------
Choose a Strategy, Develop a Plan and Follow a Process
Arthur Hill, CMT
Chief Technical Strategist, TrendInvestorPro.com
Author, Define the Trend and Trade the Trend
Want to stay up to date with Arthur's latest market insights?
– Follow @ArthurHill on Twitter
