Editor's Note: This article was originally published in John Murphy's Market Message on Friday, September 4th at 3:11pm ET.
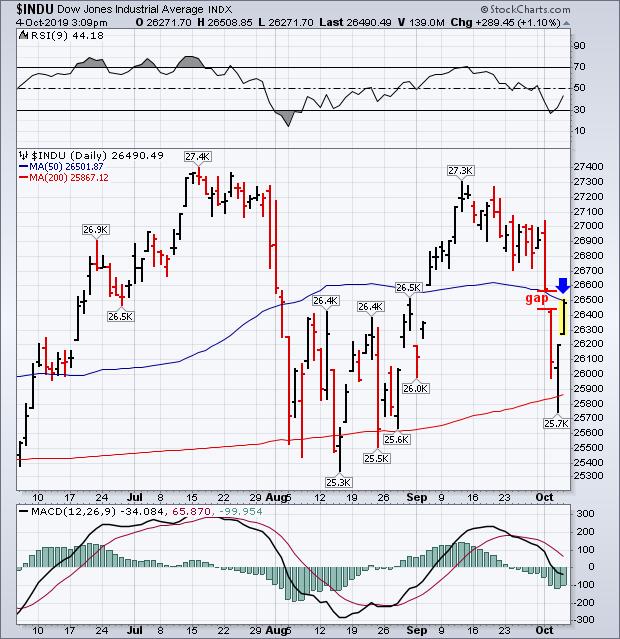
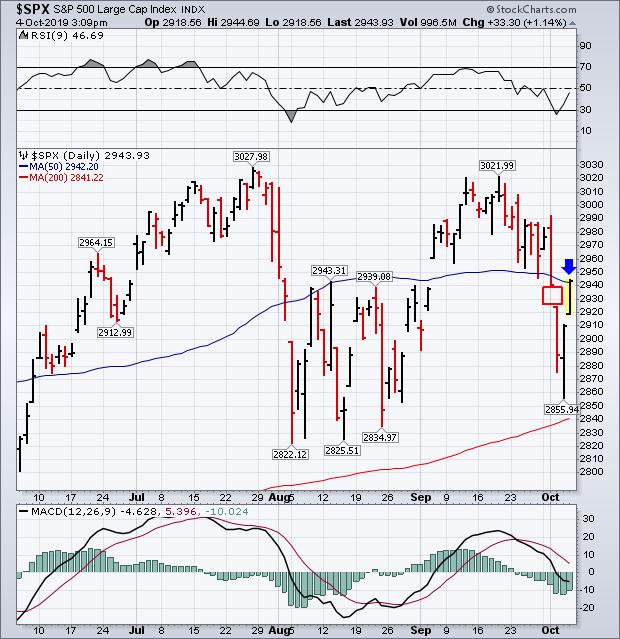
Stock prices are continuing the rebound that began with yesterday's upside reversal off their 200-day moving averages. And they're now trying to clear some overhead resistance. Chart 1 shows the Dow Industrials entering an overhead "gap" area created by Wednesday's downside price gap (red lines). An overhead gap often acts as resistance; and a move above that gap would be a positive sign. The Dow has also reached its 50-day line. A close back over that line would confirm the importance of yesterday's upside reversal. Chart 2 shows the S&P 500 having already filled all of Wednesday's overhead price gap; and testing its 50-day line. A close above its blue line would be a positive sign.
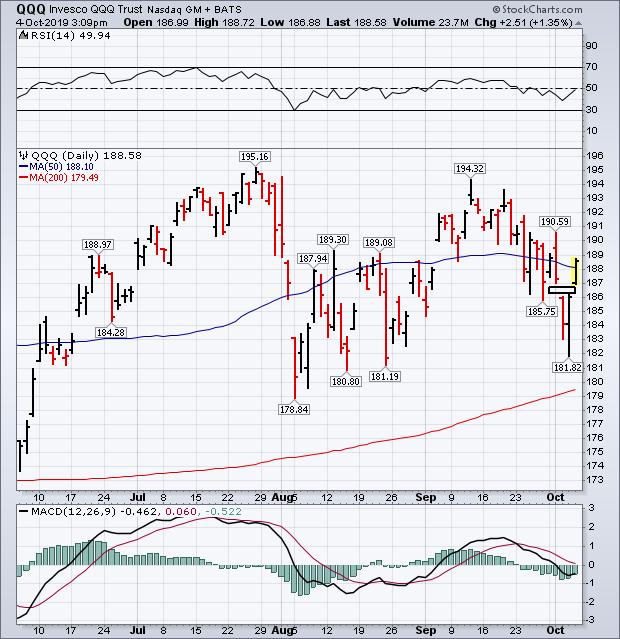
Chart 3, however, is the most impressive of the three charts. It shows the Invesco Nasdaq 100 QQQ Trust (QQQ) already trading above its blue line. In addition, the QQQ has also completed a small "island reversal" bottom (see black box). A bullish "island reversal" is formed when a downside price gap (formed on Wednesday) is followed shortly by an upside price gap (which was formed today). That's normally a good sign for a market and is usually associated with a market bottom.
Chart 1
Chart 2
Chart 3
