What Is Our Track Record?
Ever since the launch of Relative Rotation Graphs on the Bloomberg professional terminal in 2011, some of the most frequently asked questions we've received have been "What's their track record", "How well do they perform?" and "What are the trading rules?".
My answer has always been and will always be: "There is no track record". I then counter the question by asking "What is the track record of a bar-chart?". Like bar charts, RRGs are a visualization tool, not a trading system with some fixed set of rules.
Now, having said that, you can of course come up with a set of rules for using RRG in a more quant- or rules-based fashion, just like you can impose a set of trading rules on a bar-chart. I stick with my opinion that I do not think RRG should be used as a stand-alone decision tool, but rather should be part of a workflow or even a systematic approach, especially as a high-level filtering or selection tool.
RRG provides you with the BIG picture in ONE picture. But...
BUT............
To satisfy all these curious minds, I have been doing some work on testing specific situations related to rotations or positioning of securities on RRGs. I presented a very basic approach to quantifying RRG last week at the IFTA conference in Cairo and reviewed that approach in last Tuesday's episode of my StockCharts TV show Sector Spotlight. As I am of the opinion that a proper back test for a set of rules can only be applied at a portfolio level, rather than at the individual security level, I did this work on both the 11 sectors as well as on the 30 Dow stocks.
My conclusions are:
- Creating a portfolio based on ranking securities on the JdK RS-Ratio scale generally adds value.
- The approach seems to work better in a sideways or declining market than in a rising market environment, a common characteristic of relative strength based systems
- Working with a relatively large universe seems to offer better returns, i.e. 11 sectors vs. 30 Dow stocks.
(You can replay my discussion on these findings in the most recent episode of Sector Spotlight. The part on the tested portfolios starts at 9:50.)
The last test presented in that show is to hold a portfolio of the top-six stocks (16.667% each) in the Dow Jones Industrials Index, based on ranking the JdK RS-Ratio (using the weekly scale) and rebalancing that portfolio at the end of each month.
Current Portfolio
On StockCharts.com, we can find those stocks easily from the RRG page.
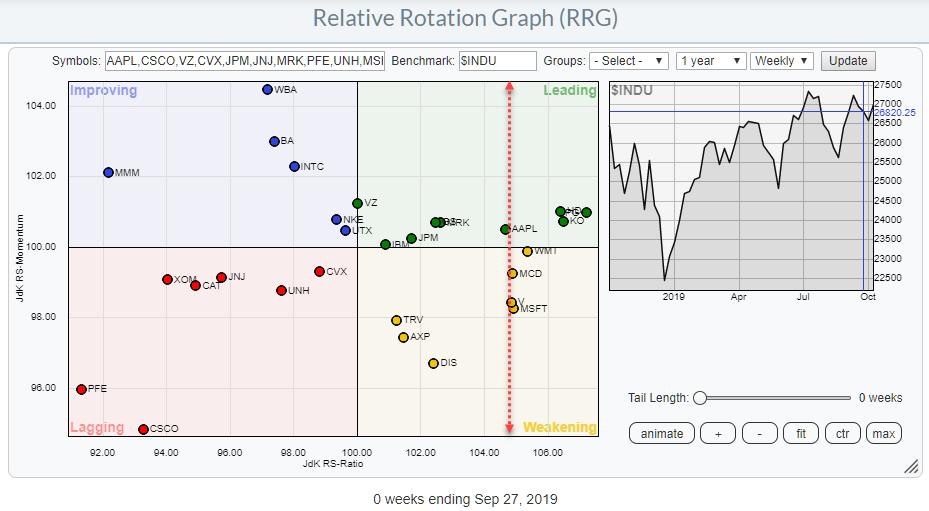
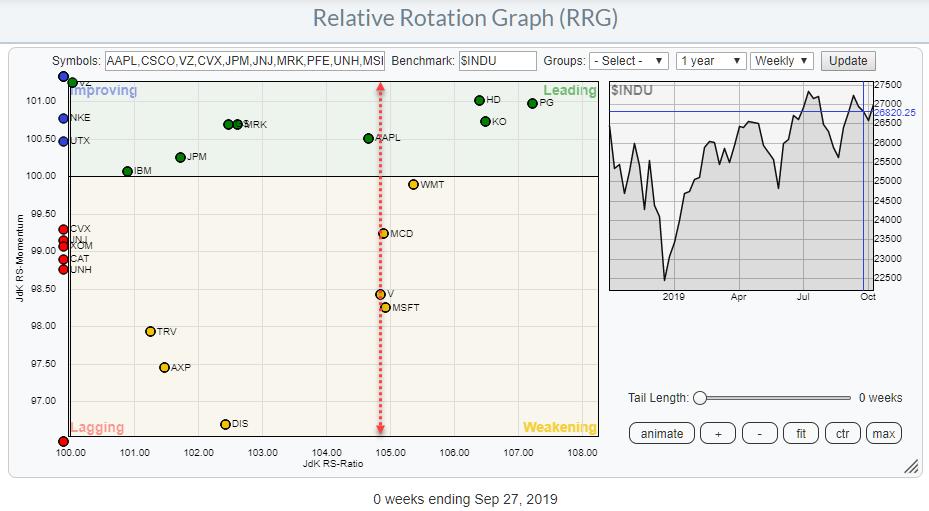
The RRG at the top of this article shows the overview for all Dow stocks at the last weekly close of September. The dotted red line separates the top-six names from the rest of the universe. As the red line runs through a cluster of stocks inside the weakening quadrant, I have printed a zoomed-in version of that chart below.

To find the current holdings of such a portfolio, simply start counting at the far right until you have reached six positions.
The current positions are:
- PG @ $ 124.57
- KO @ $ 54.31
- HD @ 229.86
- WMT @ 118.45
- MSFT @ 137.73
- MCD @ 213.16
Let's monitor this approach in coming months and see if it still holds value.
-Julius
My regular blog is the RRG Charts blog. If you would like to receive a notification when a new article is published there, simply "Subscribe" with your email address.
Julius de Kempenaer
Senior Technical Analyst, StockCharts.com
Creator, Relative Rotation Graphs
Founder, RRG Research
Want to stay up to date with the latest market insights from Julius?
– Follow @RRGResearch on Twitter
– Like RRG Research on Facebook
– Follow RRG Research on LinkedIn
– Subscribe to the RRG Charts blog on StockCharts
Feedback, comments or questions are welcome at Juliusdk@stockcharts.com. I cannot promise to respond to each and every message, but I will certainly read them and, where reasonably possible, use the feedback and comments or answer questions.
To discuss RRG with me on S.C.A.N., tag me using the handle Julius_RRG.
RRG, Relative Rotation Graphs, JdK RS-Ratio, and JdK RS-Momentum are registered trademarks of RRG Research.
Julius de Kempenaer
Senior Technical Analyst, StockCharts.com
Creator, Relative Rotation Graphs
Founder, RRG Research
Host of: Sector Spotlight
Please find my handles for social media channels under the Bio below.
Feedback, comments or questions are welcome at Juliusdk@stockcharts.com. I cannot promise to respond to each and every message, but I will certainly read them and, where reasonably possible, use the feedback and comments or answer questions.
To discuss RRG with me on S.C.A.N., tag me using the handle Julius_RRG.
RRG, Relative Rotation Graphs, JdK RS-Ratio, and JdK RS-Momentum are registered trademarks of RRG Research.
