Editor's Note: This article was originally published in John Murphy's Market Message on Friday, August 9th at 12:27pm ET.
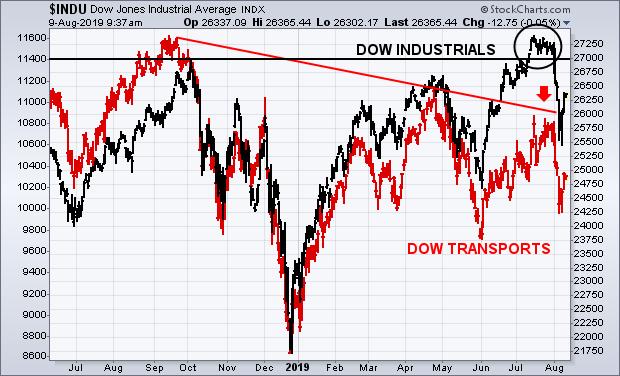
I was asked during an interview on StockCharts TV yesterday whether I was concerned about the Dow Theory divergence between the Dow Industrials and the Dow Transports. I responded that I was. But with an additional twist to that theory which is also giving a warning signal. But let's start with the more traditional relationship first. Chart 1 compares the Dow Industrials (black bars) and the Dow Transports (red bars) over the last year. The black circle in Chart 1 shows the Dow Industrials rising above last year's high during July to reach a new record. The red bars, however, show the Dow Transports trading well below their 2018 high. In fact, the declining red trendline shows that the transports peaked last September, and have been forming a pattern of "lower peaks" since then. The Dow Theory holds that an upside breakout by the Dow Industrials needs to be confirmed by a similar breakout in the transports. The fact that the transports have lagged so far behind the industrials is not a good sign for the market. That's because the more economically-sensitive transportation stocks have a history of turning down first in the late stages of a bull market. But the third Dow Average may also be giving a warning.
Chart 1

