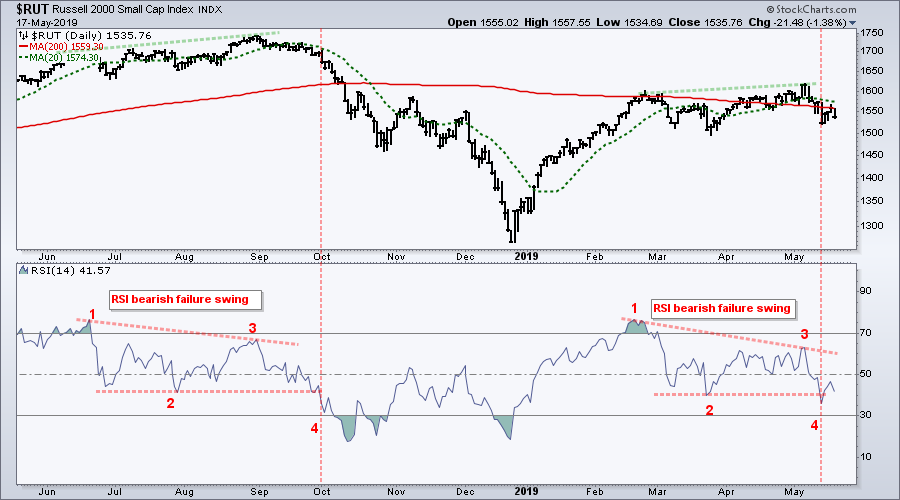
 The bearish failure swing is a bearish RSI signal from Welles Wilder, creator of RSI. Note that this signal is NOT the same as a bearish divergence, even though a bearish divergence is also possible at the same time.
A bearish failure swing has four parts: RSI moves above 70 (1), RSI falls back below 70 (2), RSI rises and fails to exceed 70 (3), RSI falls below the intermittent low (4). The failure occurs when RSI fails to exceed 70 on the bounce. Signal confirmation occurs when RSI breaks its prior low. The failure below 70 shows waning upside momentum, while the break below the prior low shows an increase in downside momentum.
The chart above shows the Russell 2000 trading well below its September high and seriously lagging the S&P 500. The small-cap index is also back below its falling 200-day SMA. The indicator window shows RSI with two bearish failure swings in the last nine months. The first occurred in early October and foreshadowed a sizable decline. The second signal triggered this week when RSI broke below its March low.
Astute chartists will also notice that the Russell 2000 formed higher highs during each failure swing. Higher highs in the index and lower highs in RSI amount to bearish divergences Personally, I do not use bullish or bearish divergences for trading signals. As far as I am concerned, the break below the 200-day, the falling 200-day SMA, underperformance and RSI break down point to weakness in the Russell 2000 and this is enough reason to avoid small-caps.
Arthur Hill, CMT
Senior Technical Analyst, StockCharts.com
Author, Define the Trend and Trade the Trend
Want to stay up to date with the latest market insights from Arthur?
– Follow @ArthurHill on Twitter
– Subscribe to Art's Charts
– Watch On Trend on StockCharts TV (Tuesdays / Thursdays at 10:30am ET)

