My process is built around simplicity. I am of the firm belief that investors, as well as the financial industry as a whole, tend to unnecessarily complicate things. As a result, we are led to believe that we need to track an endless number of data points to have a proper situational awareness for the markets. In reality, we need to work smarter, not harder. A small number of selectively prioritized and appropriately meaningful data points are all a savvy investor needs to get a fairly accurate read on what’s happening out there.
When a chart is in an uptrend, it’s easy to overthink all the different scenarios that could occur. Perhaps the stock could accelerate, decelerate, rise rapidly, fall rapidly, stagnate or anything in between!
As Charles Dow first posited, an uptrend is a series of higher highs and higher lows. It’s that simple. As long as the uptrend is intact, with the highs and the lows both getting higher, why spend any further time troubling over future paths? The trend is your friend.
With that in mind, here are six trend lines that you should be watching. If you track these lines, you should have a good read on where things are headed. More importantly, you’ll see when the uptrends are no longer in place.
1) Nasdaq 100 index
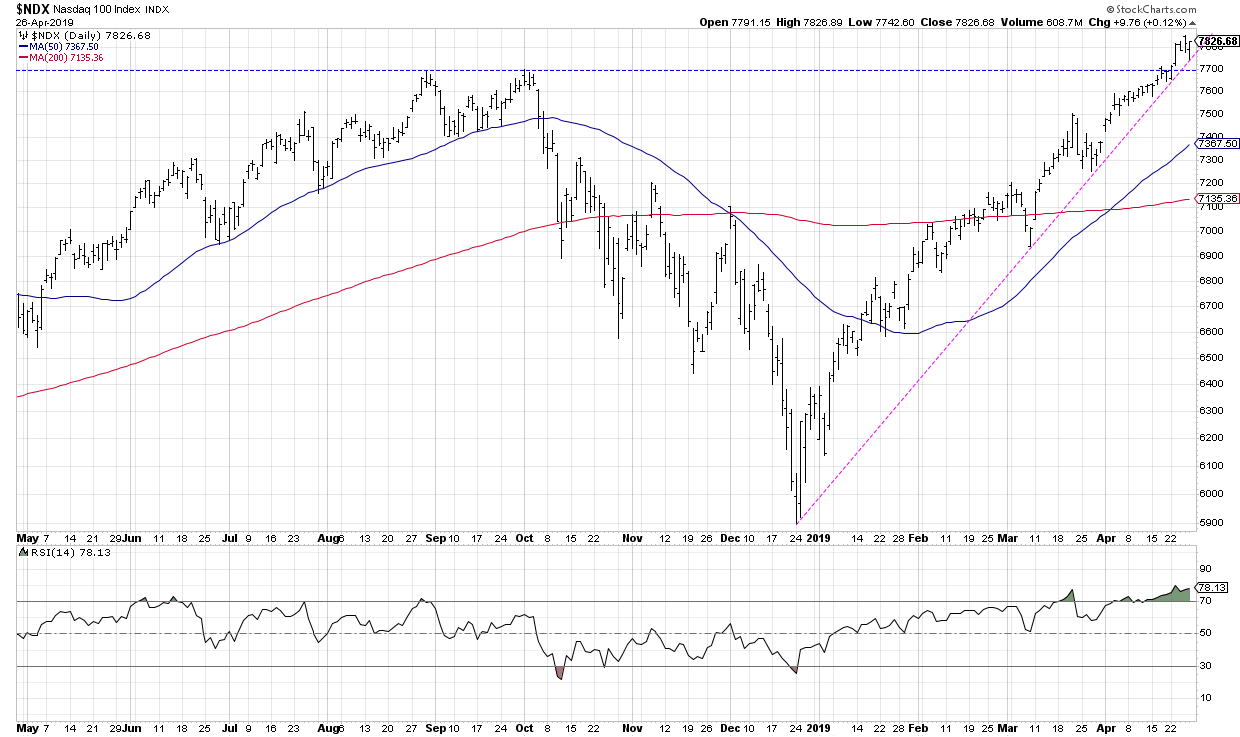
Technology has remained leadership through most of 2019, with the tech-heavy Nasdaq 100 index outperforming the S&P 500 since mid-November 2018. Connecting the Christmas Eve low with the early March low gives you a trend line that lines up quite well with subsequent lows in March and April.
The NDX recently became extremely overbought, with an RSI above 80. This suggests to me that we'll see a short-term pullback but still further upside. Of course, with this trend line intact, the trend still remains ever upward.
2) Semiconductors
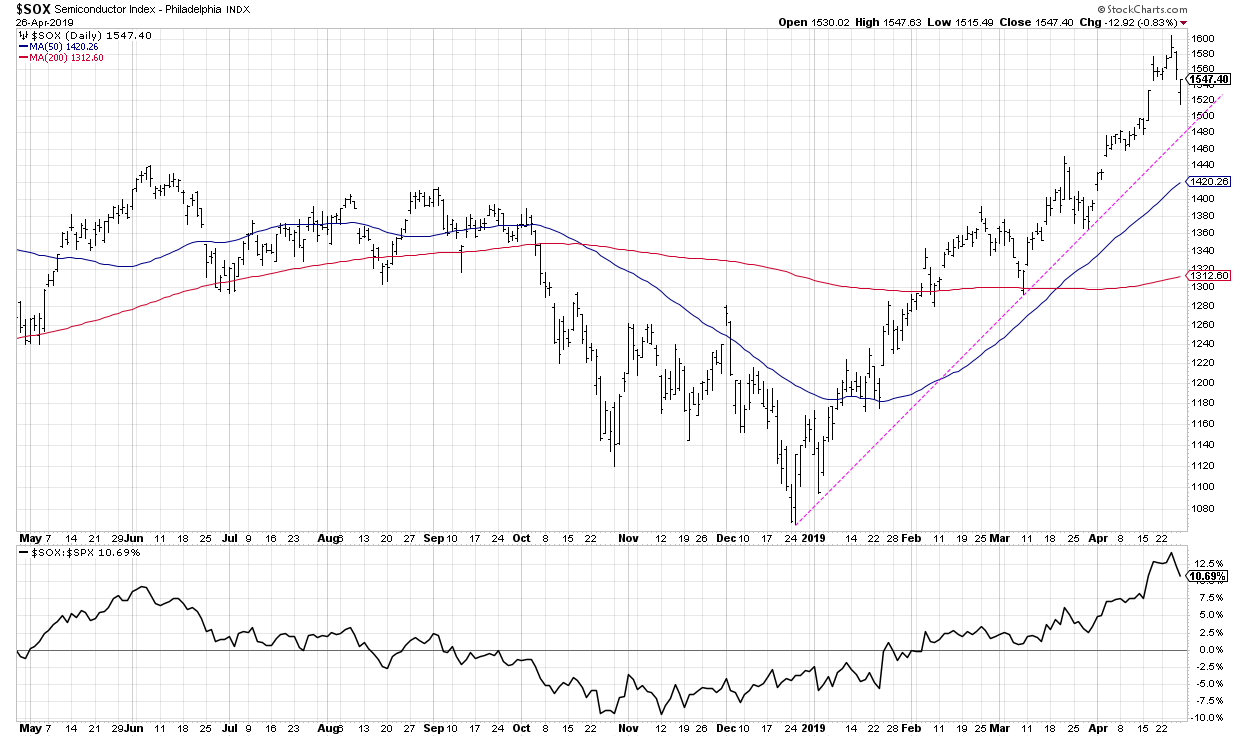
With semiconductors, similar to the NDX chart, we have another recognition of the outperformance of technology through this bullish market phase. However, semiconductors deserve their own spot on the list because when they are doing well, the market as a whole tends to be doing well.
3) Microsoft
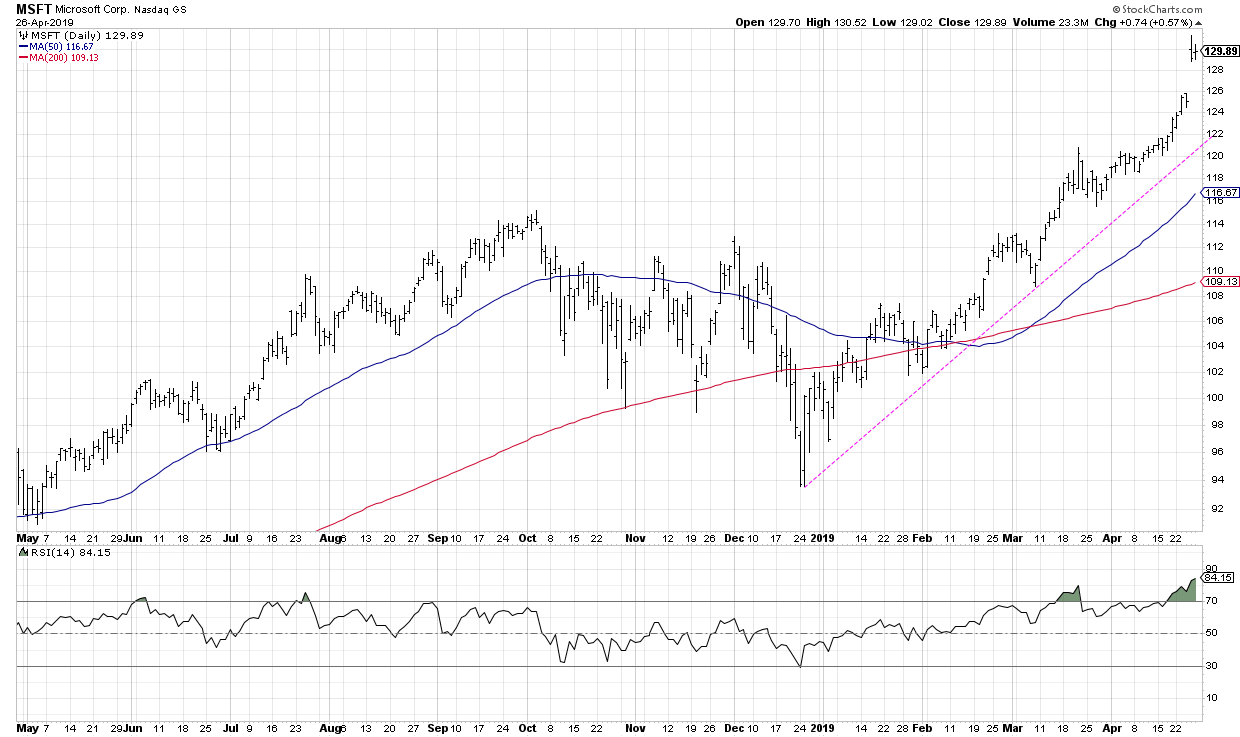
To put it quite simply, when the largest company in the world (by market cap) is gapping higher above an established trend line, it’s hard to be anything but constructive on the markets. To put it a different way, it would be difficult for the market to be substantially weaker with MSFT in a consistent uptrend.
4) Amazon
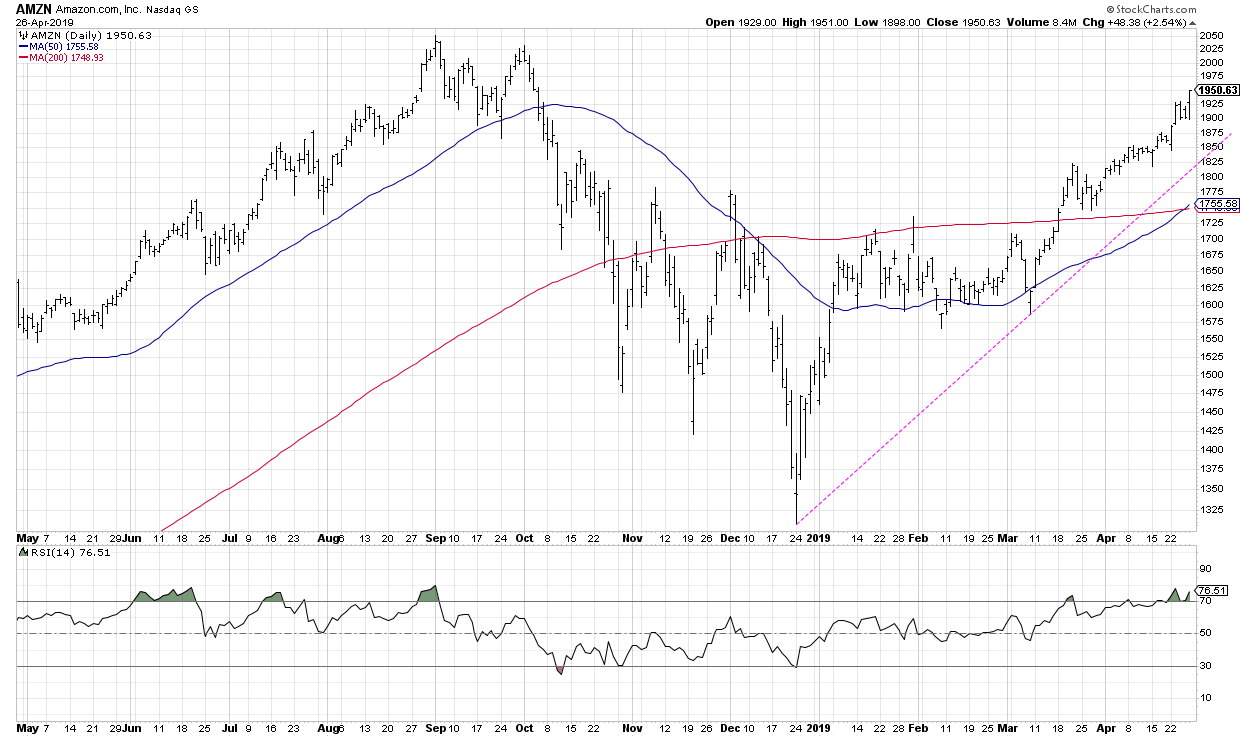
Along with the largest technology name, we now see the largest consumer name in a consistent uptrend, making higher highs and higher lows. Until these two stocks start breaking trend lines, the market as a whole is likely in fine shape.
5) Offense vs. Defense
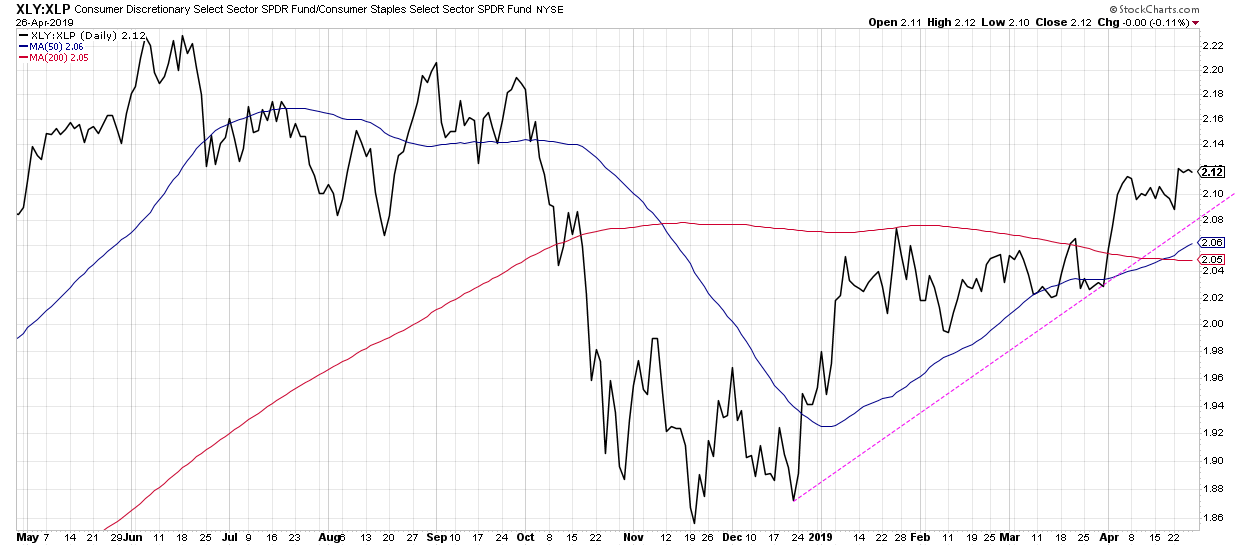
Are investors favoring more of the offense (Discretionary) or defense (Staples) within the consumer space? This ratio actually bottomed in November 2018 and hit another high this week. As long as this uptrend persists, investors are still tilted to more of a risk-on posture within consumer.
6) Bond prices
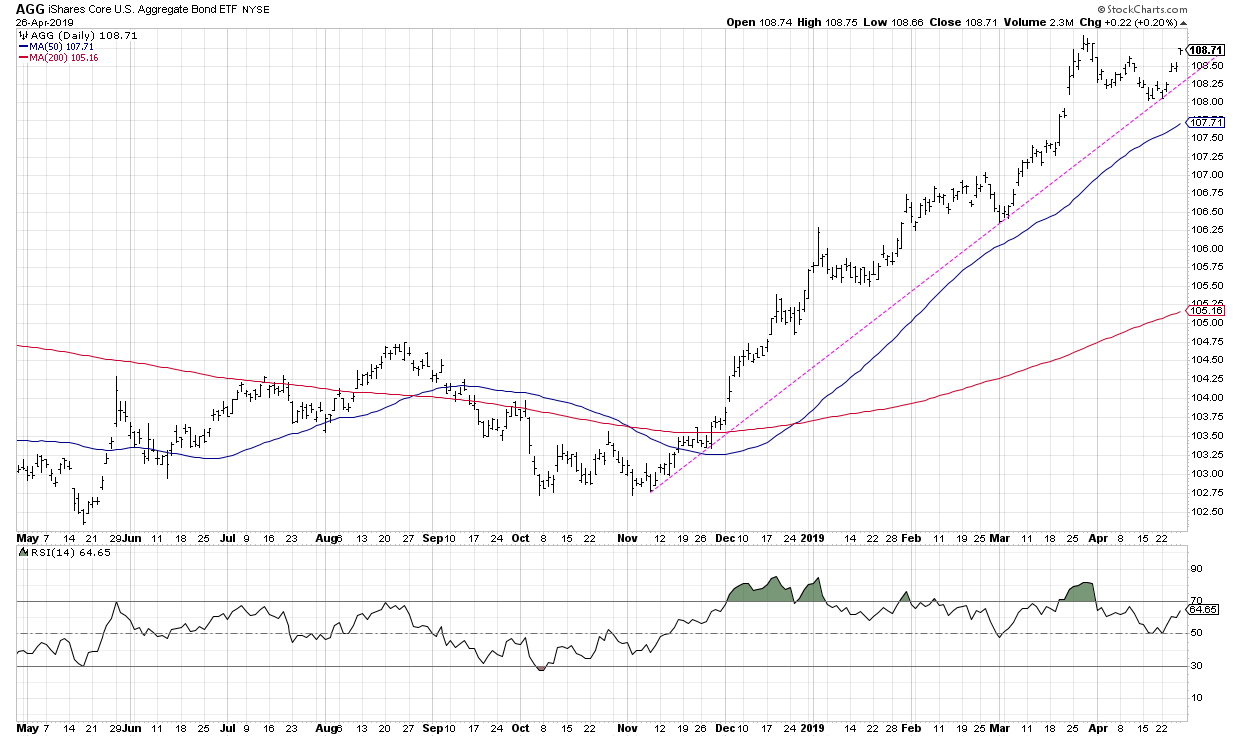
Finally, we have bond prices, here in the form of the iShares Core US Aggregate Bond ETF. Stock and bond prices have been rising in tandem in 2019; while a breakdown in this chart wouldn’t necessarily have a direct correlation to a breakdown in stocks, it would represent a change in the overall market environment with higher interest rates in store. Definitely worth watching.
As an aside, the world is not just filled with perfectly bullish charts at the moment. A stock like Intel would have made this list a week ago.
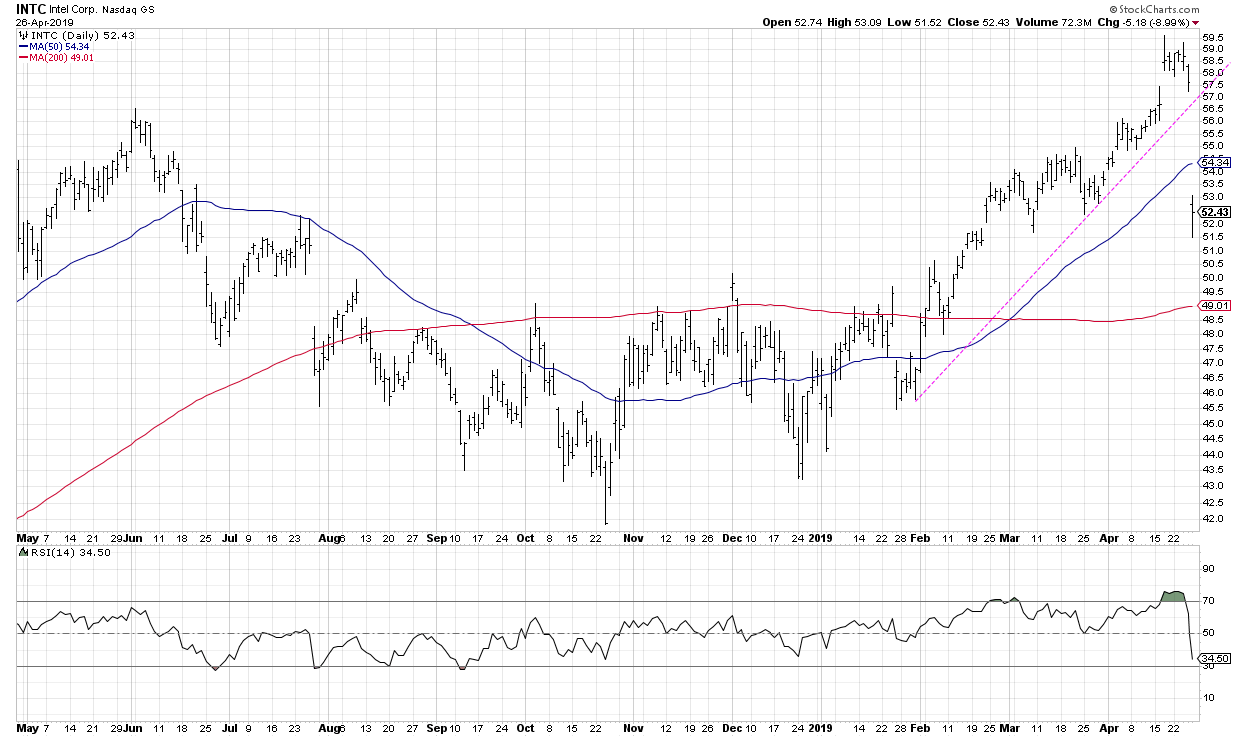
Remember, trend lines are not drawn to last forever. They are meant to acknowledge a certain trend in place for a certain price. More importantly, they are designed to recognize when that trend is no longer in place. Watching the trend lines on these six charts should provide you with a clear set of signals for when these long-term uptrends are beginning to end.
RR#6,
Dave
David Keller, CMT
President, Sierra Alpha Research LLC
Disclaimer: This blog is for educational purposes only and should not be construed as financial advice. The ideas and strategies should never be used without first assessing your own personal and financial situation, or without consulting a financial professional.
The author does not have a position in mentioned securities at the time of publication. Any opinions expressed herein are solely those of the author and do not in any way represent the views or opinions of any other person or entity.
