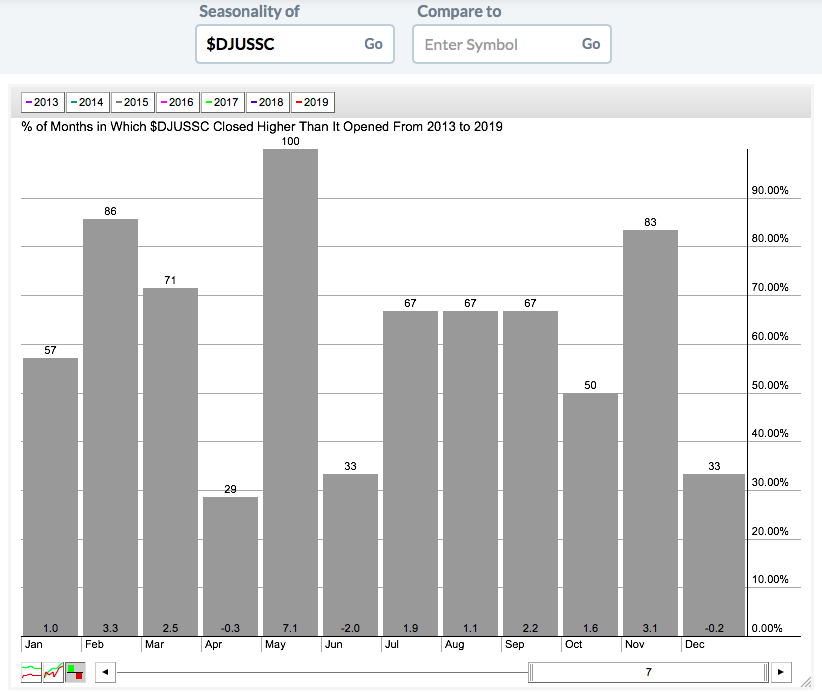
Okay, let's start with the short-term reason. Throughout much of this bull market, the month of May has been kind to semiconductors ($DJUSSC). In fact, the DJUSSC has advanced in each of the last 7 years during May. Check out this seasonal pattern:
 Not only have semiconductors moved higher during May, but they have scorched higher! Their average May return of 7.1% over these past 7 years more than doubles any other calendar month. Go away in May? I think not!
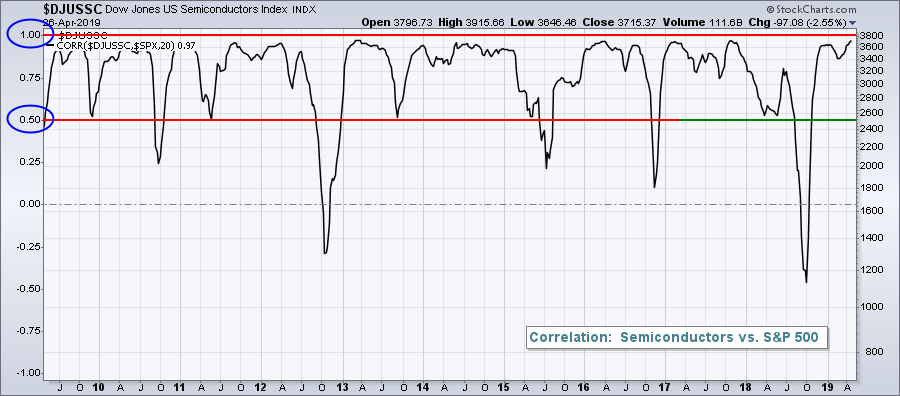
Next, consider what drives the stock market higher. I'd be hard-pressed to find another area of the market more positively correlated with the S&P 500 than semiconductors. If the DJUSSC is advancing, there's a pretty decent chance the S&P 500 is moving right along with it:
 During the past decade, the above chart illustrates how closely tied the S&P 500 is to the DJUSSC. The correlation coefficient has been almost exclusively between +.50 and +1.00. Drops below that zone have not lasted long at all.
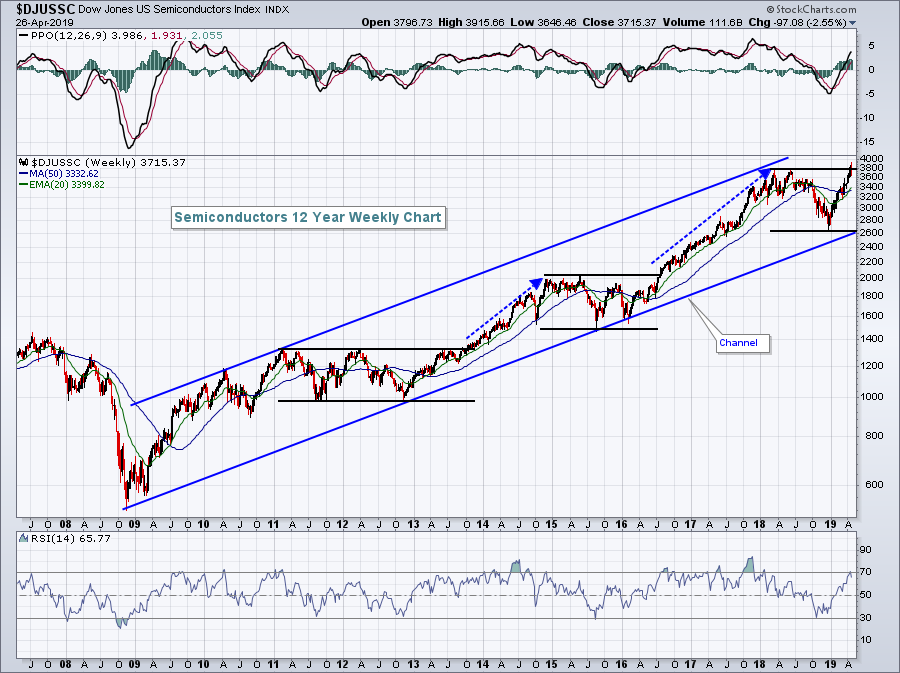
Finally, let's consider the technical pattern of semiconductors over the long-term. Take a look at the 10 year weekly chart:
 There have been two prior instances when the DJUSSC has consolidated sideways for at least one year - from 2011 to 2013 and from late-2014 to 2016. In both cases, once price resistance was cleared, the DJUSSC soared higher. The DJUSSC formed a double top in the first half of 2018 and, after consolidating for more than a year, it just broke out again. This bodes well for semiconductors and also for the S&P 500.
We're going higher.
Two semiconductor stocks are among my favorites to trade currently and are amongst a handful of solid trading candidates overall. If you trade individual stocks and you'd like to see these annotated charts, send me an email at tomb@stockcharts.com. I'll send them to you over the weekend. You won't need to be a StockCharts member to view these charts, but you will need to be a member in order to download and save the charts into a StockCharts ChartList.
Happy trading!
Tom
