ChartWatchers

Russell 2000 Is Now Retesting Its 200-Day Average

John Murphy

John Murphy

Chief Technical Analyst, StockCharts.com

Editor's Note: This article was originally published in John Murphy's Market Message on Friday, October 5th at 2:02pm ET.


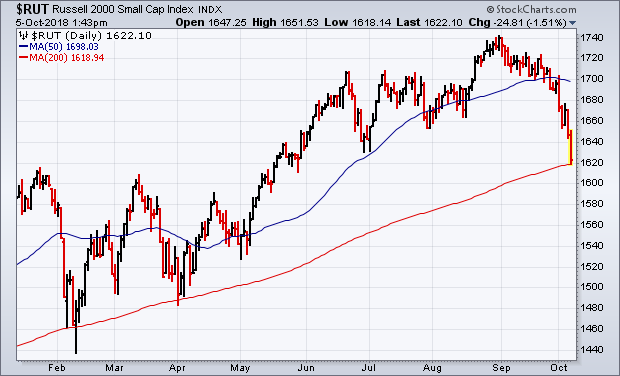
Tuesday's message showed the Russell 2000 Small Cap Index being the first of the major market indexes to fall below its 50-day line, and warned that the selloff in small cap stocks might be a warning that the stock uptrend is losing momentum. Small caps continue to lead large cap stocks lower. Chart 5 shows the RUT falling today to its lowest level in four months and sitting right on its 200-day average. That's an important test for small cap stocks, and possibly for the rest of the market. Small caps have a history of leading stocks lower during market pullbacks and corrections.

Chart 5
John Murphy
About the author: is the Chief Technical Analyst at StockCharts.com, a renowned author in the investment field and a former technical analyst for CNBC, and is considered the father of inter-market technical analysis. With over 40 years of market experience, he is the author of numerous popular works including “Technical Analysis of the Financial Markets” and “Trading with Intermarket Analysis”. Before joining StockCharts, John was the technical analyst for CNBC-TV for seven years on the popular show Tech Talk, and has authored three best-selling books on the subject: Technical Analysis of the Financial Markets, Trading with Intermarket Analysis and The Visual Investor. Learn More